Dapr Set Up
You run Dapr from a CLI that you install on a local machine. Once you have the CLI installed you can then run commands to spin up applications locally.
You can also very easily install Dapr onto an AKS cluster. Dapr runs on AKS as a Custom Resource Definition. Getting your AKS services to work with Dapr is fundamentally very simple:
- Install Dapr onto your AKS cluster
- Add an annotation to the YAML definition of your service to enable Dapr integration
- Deploy your service to AKS
That's it!
How does it work?
The mechanics for Dapr integration are actually pretty simple. When Dapr is installed on your AKS cluster it listens for the creation of new pods. If your pod has the 'Dapr enabled' annotation, Dapr will spin up a the Dapr sidecar container to run in your pod.
Dapr Dashboard
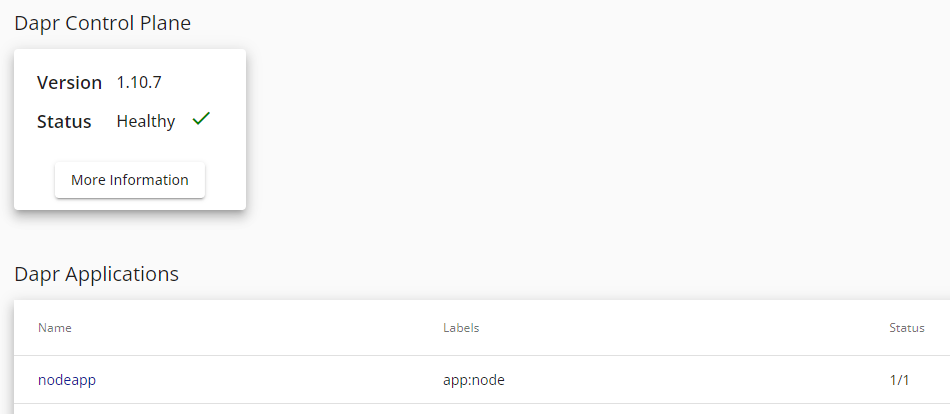
Dapr installs a number of management tools - one of these is the Dapr Dashboard. This gives you a handy way of viewing all of your installed Dapr applications, components and configurations. The dashboard exposes a web ui and you can connect to it via your browser. By default, the service is private, so you will first of all need to port-forward into it:
kubectl port-forward svc/dapr-dashboard 8081:8080 -n dapr-system
You can now see applications which are running with Dapr enabled:
Click on image to enlarge
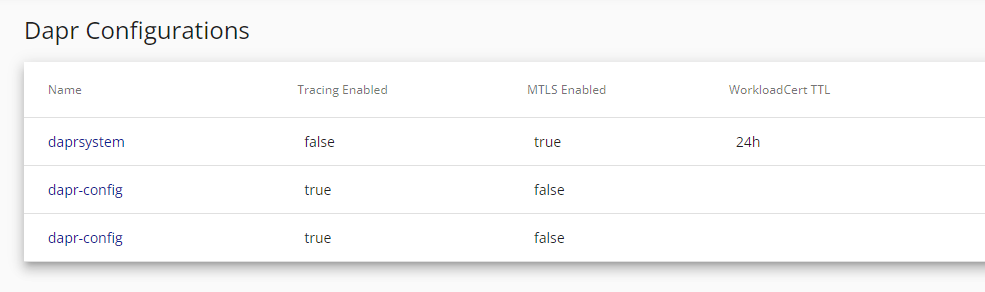
You can also see Dapr configurations:
Click on image to enlarge
As you can see above, you can have multiple configurations. This means that as well as having the default system configuration you can define configurations for namespaces or functional domains (such as tracing).
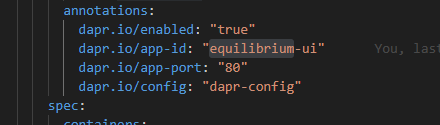
This is the YAML spec for an application which is Dapr-enabled and is pointing to a Dapr configuration file called 'dapr-config':
Click on image to enlarge
When you use the 'dapr.io/config' annotation you are specifying the name of a Kubernetes configuration entity. The Dapr engine will expect that configuration in the namespace in which your service is running.
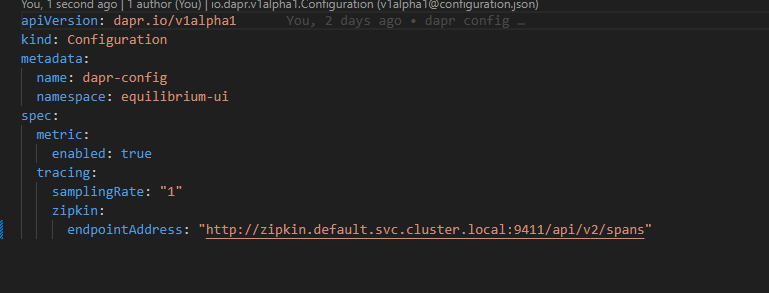
Below is an example of how the config file might look:
Click on image to enlarge
So this application has Dapr enabled and it is pointing to a Dapr configuration. That configuration has tracing and metrics enabled. This means that traces will be sent to a tracing endpoint. In this instance, the tracing endpoint is a Zipkin server (which is running in the cluster's default namespace). To get this to work you will obviously need to install Zipkin in your cluster.
Dapr Configuration
Dapr configuration is defined by YAML config files. When you first install Dapr into your cluster it will create a default configuration file in the dapr-system namespace. You can see this if you look at the Dapr configuration in the Dapr dashboard
Zipkin
To use zipkin as our tracing server we will first of all need to install Zipkin on our cluster. To do this run the following command from your terminal - this obviously assumes you are connected to a cluster:
kubectl create deployment zipkin --image openzipkin/zipkin
Next we need to create a kubernetes service for the Zipkin instance:
kubectl expose deployment zipkin --type ClusterIP --port 9411
Our services are running in separate namespaces. They will read their configuration from the configuration object that had been defined for their namespace.
We have a service called equilibrium-ui running in an kubernetes namespace also called equilibrium ui.
we will define this dapr configuration for the namespace:
    apiVersion: dapr.io/v1alpha1
    kind: Configuration
    metadata:
        name: dapr-config
        namespace: equilibrium-ui
    spec:
        metric:
        enabled: true
        tracing:
        samplingRate: "1"
        zipkin:
            endpointAddress: "http://zipkin.default.svc.cluster.local:9411/api/v2/spans"
Save this as dapr-config.yaml and then deploy it:
kubectl apply -f dapr-config.yaml -n equilibrium-ui
In this instance we have defined a Zipkin endpoint. We could also define endpoints for other tracing providers in the same configuration. Popular alternatives are products such as Jaeger or platforms such as New Relic and Datadog. Now we update the YAML definition of our equilibrium-ui service to point to the configuration:
    annotations:
        dapr.io/config: "dapr-config"
Prometheus
One of the most prevalent patterns for viewing metrics is to use the Prometheus/Grafana stack where Prometheus is the ingestion and storage point and Grafana is the visualisation platform.
The process is slightly different to setting up tracing. This is because Prometheus uses a pull approach. We therefore need to
1) ensure that metrics are enabled (they are enabled by default)
2) configure Prometheus to scrape from the Dapr sidecar.
By default the Dapr sidecar will expose port 9090 for metrics collection. You can actually verify this quite easily. First of all use kubectl to connect to the container:
kubectl exec -it {pod-name} -n {namespace} --container {container-name} -- sh
and then use curl to connect to port 9090
curl http://localhost:9090/metrics
The response will be the current block of metrics held by the metrics server. Effectively, therefore, unless you have previously disabled metrics collection or wish to use a custom port, there is no Dapr-specific configuration required. Instead, you just need to install Prometheus and Grafana on your cluster and configure Grafana to use your Prometheus instance as a Data Source.
The Dapr docs provide the following instructions for installing Prometheus on your cluster:
https://docs.dapr.io/operations/monitoring/metrics/prometheus/
1. First create namespace that can be used to deploy the Grafana and Prometheus monitoring tools
kubectl create namespace dapr-monitoring
2. Install Prometheus
    helm repo add prometheus-community https://prometheus-community.github.io/helm-charts
    helm repo update
    helm install dapr-prom prometheus-community/prometheus -n dapr-monitoring
This Helm chart will also create a Persistent Volume and a persistent Volume claim for 8 GB of storage. The purpose of this is obviously to preserve your metrics in the event that your pod is re-started your pod is restarted.
3. Validation
Ensure Prometheus is running in your cluster.
    kubectl get pods -n dapr-monitoring

    NAME                                                READY   STATUS    RESTARTS   AGE
    dapr-prom-kube-state-metrics-9849d6cc6-t94p8        1/1     Running   0          4m58s
    dapr-prom-prometheus-alertmanager-749cc46f6-9b5t8   2/2     Running   0          4m58s
    dapr-prom-prometheus-node-exporter-5jh8p            1/1     Running   0          4m58s
    dapr-prom-prometheus-node-exporter-88gbg            1/1     Running   0          4m58s
    dapr-prom-prometheus-node-exporter-bjp9f            1/1     Running   0          4m58s
    dapr-prom-prometheus-pushgateway-688665d597-h4xx2   1/1     Running   0          4m58s
    dapr-prom-prometheus-server-694fd8d7c-q5d59         2/2     Running   0          4m58s
If you encounter any errors with the Helm install then you might want to check that you are running the latest versions of kubectl and Helm.
kubectl version
helm version
If the install has succeeded you should now be able to connect to the Prometheus web ui. By default it does not have a public IP address so you will need to port-forward:
kubectl port-forward svc/dapr-prom-prometheus-server 8084:9090 -n dapr-monitoring
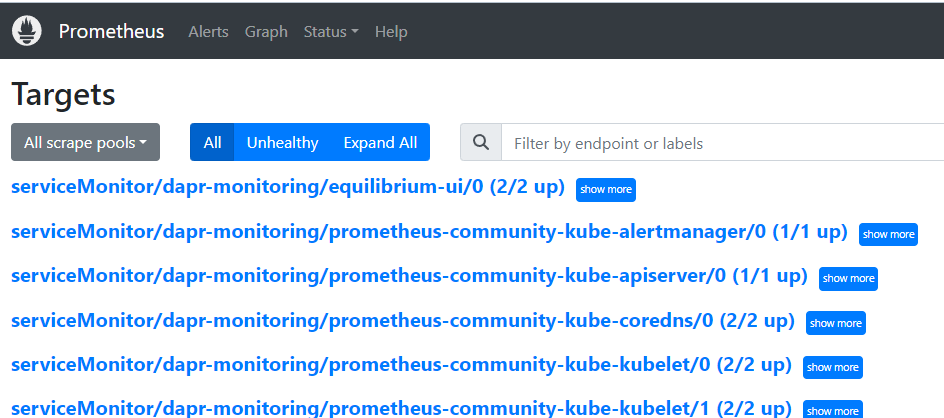
This is a really useful UI for viewing your Prometheus configuration. It allows you to see
- scrape-definitions
- targets
- alerts
- configurations
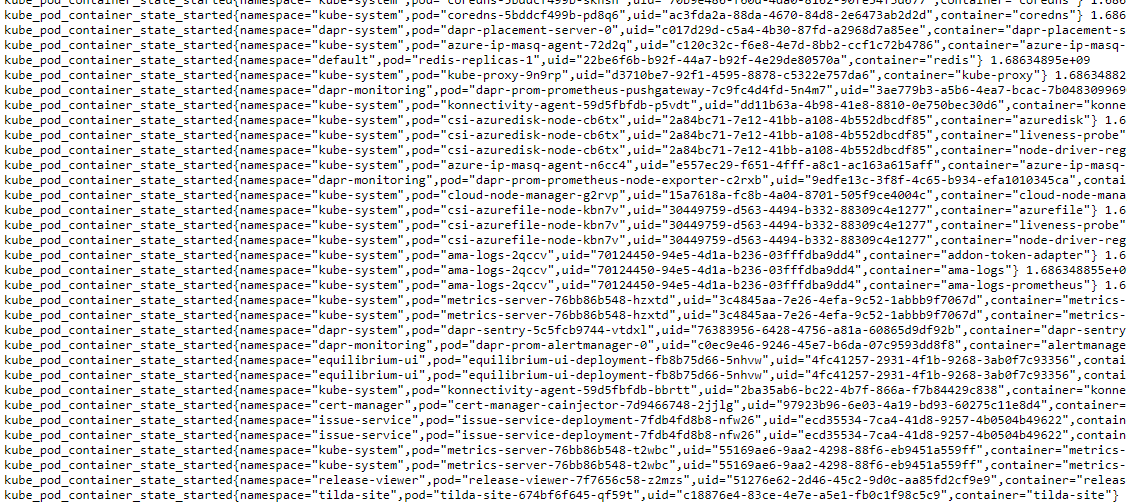
If you are so inclined, you can also port-forward into the Prometheus metrics service - although all you will see is a very large text file with name value pairs.
kubectl port-forward svc/dapr-prom-kube-state-metrics 8084:8080 -n dapr-monitoring
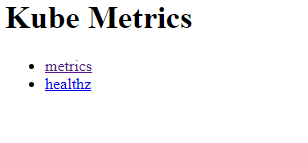
The metrics server is meant to be consumed as an API. Although it does have a UI it is extremely rudimentary:
Click on image to enlarge
If you click on the 'metrics' link you will see an example of the raw data emitted by the endpoint.
Click on image to enlarge
Our next task is to set up Grafana to structure and visualise this raw data.
Set Up
Add the Grafana Helm repo:
    helm repo add grafana https://grafana.github.io/helm-charts
    helm repo update
Install the chart:
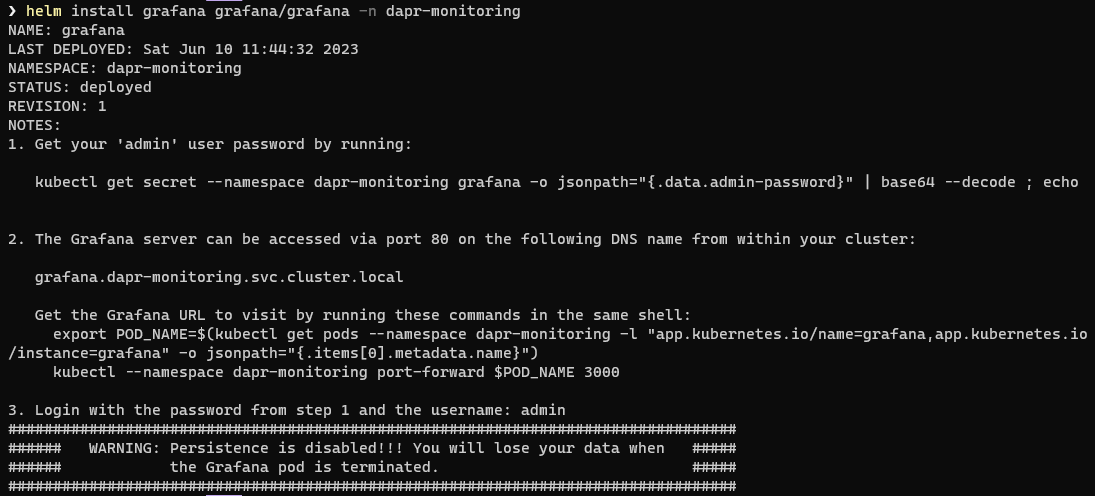
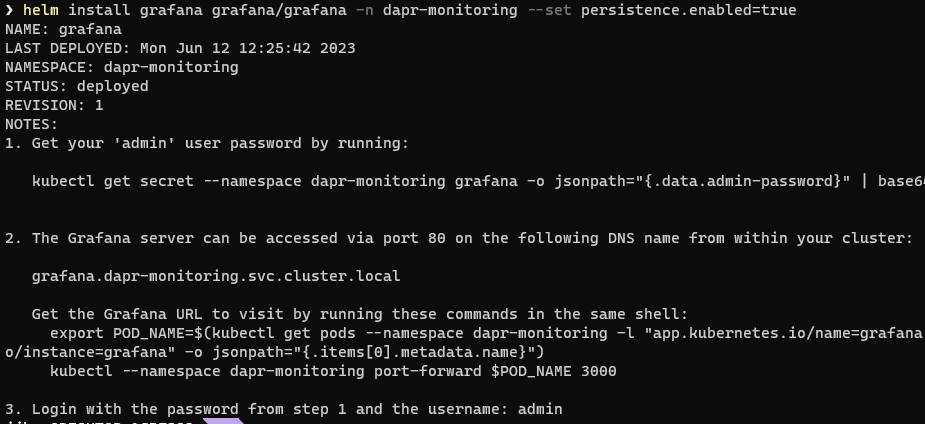
helm install grafana grafana/grafana -n dapr-monitoring
You should now see an output something like this:
Click on image to enlarge
It is worth paying particular attention to this warning:
Click on image to enlarge
By default, Grafana does not persist your configuration data. This means it does not persist any meta data for the Data Sources you set up or the Dashboards you import or configure. All of this is lost when your pod terminated or restarted. If you want to persist your data then you can append an argument as below:
helm install grafana grafana/grafana -n dapr-monitoring --set persistence.enabled=true
This time you will not see the warning about persistence being disabled:
Click on image to enlarge
If you look at your aks configuration in the Azure portal you can see details for the storage that has been created:
Click on image to enlarge
The installation has created a Persistent Volume and a Persistent Volume claim for 10 GB
Next, retrieve the admin password for Grafana:
kubectl get secret --namespace dapr-monitoring grafana -o jsonpath="{.data.admin-password}" | base64 --decode ; echo
The above command assumes that you are running in a bash session. If you try this in a standard Windows terminal you will get an error. To get around this you could either run the command in a Git Bash session or use the following Powershell commands:
    $pwd = kubectl get secret --namespace dapr-monitoring grafana -o jsonpath="{.data.admin-password}"
    [Text.Encoding]::Utf8.GetString([Convert]::FromBase64String($pwd)) | Write-Host
You will get a password similar to `cj3m0OfBNx8SLzUlTx91dEECgzRlYJb60D2evof1%`. Remove the `%` character from the password (it may not always be there) to get `cj3m0OfBNx8SLzUlTx91dEECgzRlYJb60D2evof1` as the admin password.
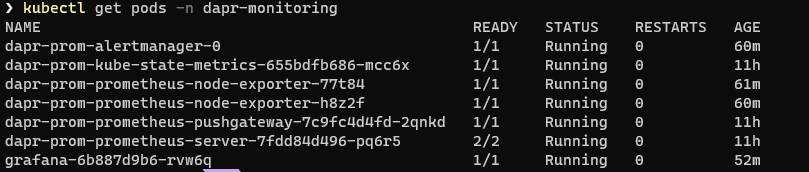
To verify that grafana has been installed correctly you can run this command:
kubectl get pods -n dapr-monitoring
You should see something like this:
Click on image to enlarge
Configure your data source
We now have Prometheus and Grafana up and running in our cluster. Grafana can visualise data from a multitude of different sourfces. We are now going to configure our Grafana instance to use the prometheus instance we set up earlier. Port-forward to svc/grafana:
kubectl port-forward svc/grafana 8085:80 -n dapr-monitoring
You should now see a UI with the Grafana login screen. Log in with the username 'admin' and the password which you retrieved previously.
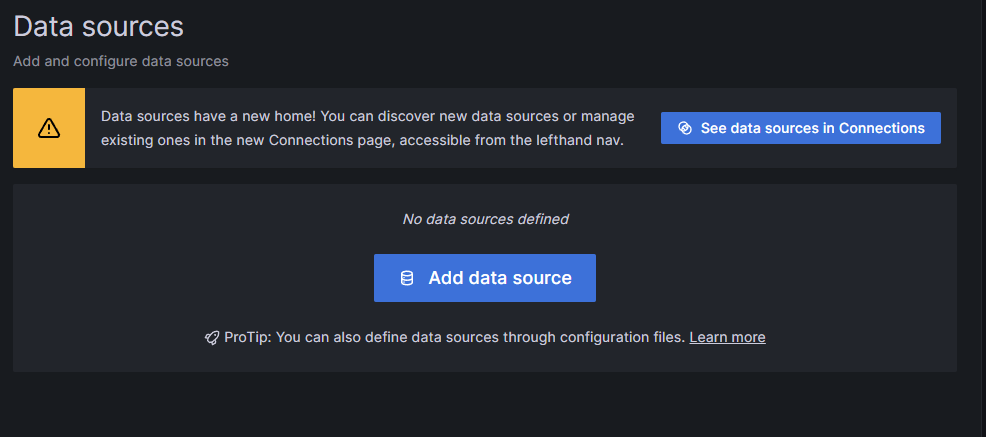
Select `Configuration` and `Data Sources`
Click on image to enlarge
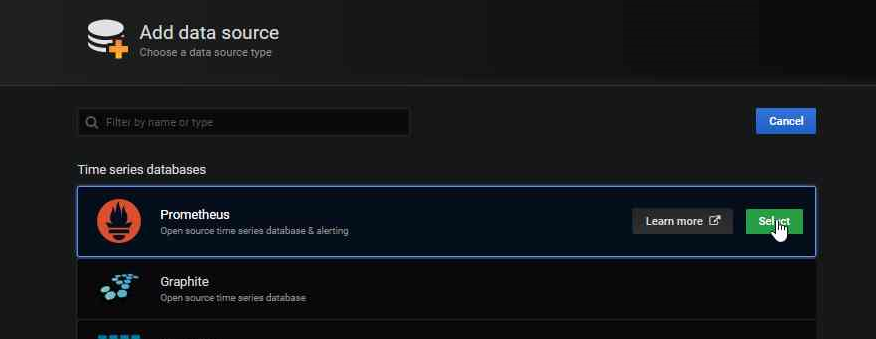
Add Prometheus as a data source.
Click on image to enlarge
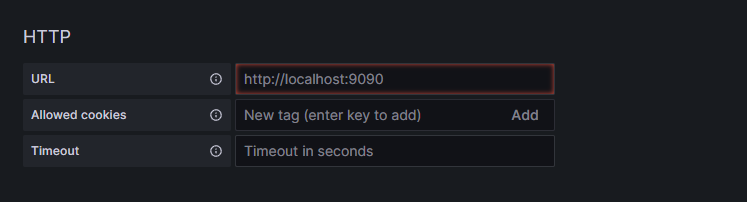
On the next screen you will need to enter your Prometheus Url:
Click on image to enlarge
Get your Prometheus HTTP URL
The Prometheus HTTP URL follows the format `http://{prometheus service endpoint}.{namespace}`
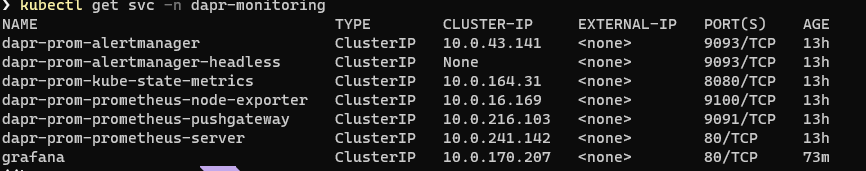
Start by getting the Prometheus server endpoint by running the following command:
kubectl get svc -n dapr-monitoring
Click on image to enlarge
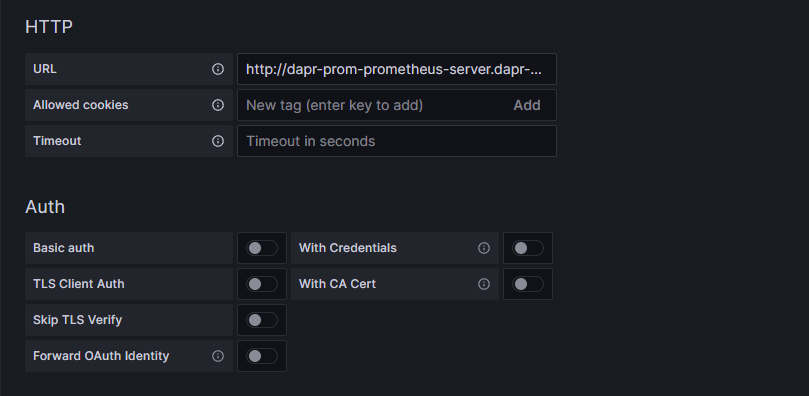
In this instance the server name is `dapr-prom-prometheus-server` and the namespace is `dapr-monitoring`, so the HTTP URL will be:
`http://dapr-prom-prometheus-server.dapr-monitoring`. Now enter the Url as below.
Click on image to enlarge
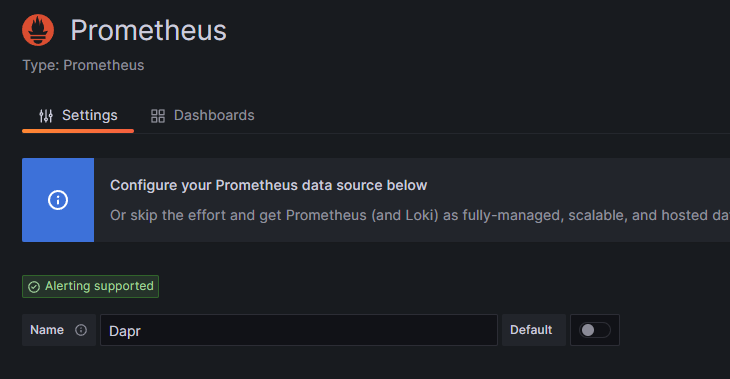
The name for the Data Source will default to Prometheus. This would seem to be an appropriate name. One drawback though, is that Dapr provides a set of Grafana dashboard templates where the Data Source name is defined as 'Dapr'. Since we will be using these templates in a later step we will change the data source name to 'Dapr'. This is purely for the purpose of this exercise so that the templates don't break.
In reality 'Dapr' is not a great name for our Data Source as the Prometheus instance may be serving many applications - not just our Dapr services.
Click on image to enlarge
Then scroll down the page and click on the Save and Test button
Click on image to enlarge
We're good to go!
Azure Managed Grafana
In the above instance, we have set up our own grafana running in our cluster. Azure now provides its own managed Grafana service which runs as a PAAS offering. The upside to this is that you do not need to maintain your own grafana instance. Thew downside is that it may be more expensive. This is obviously one of the continual trade-offs between PAAS and self-managed resources in Azure.
You can get an overview of Azure Managed Grafana here.
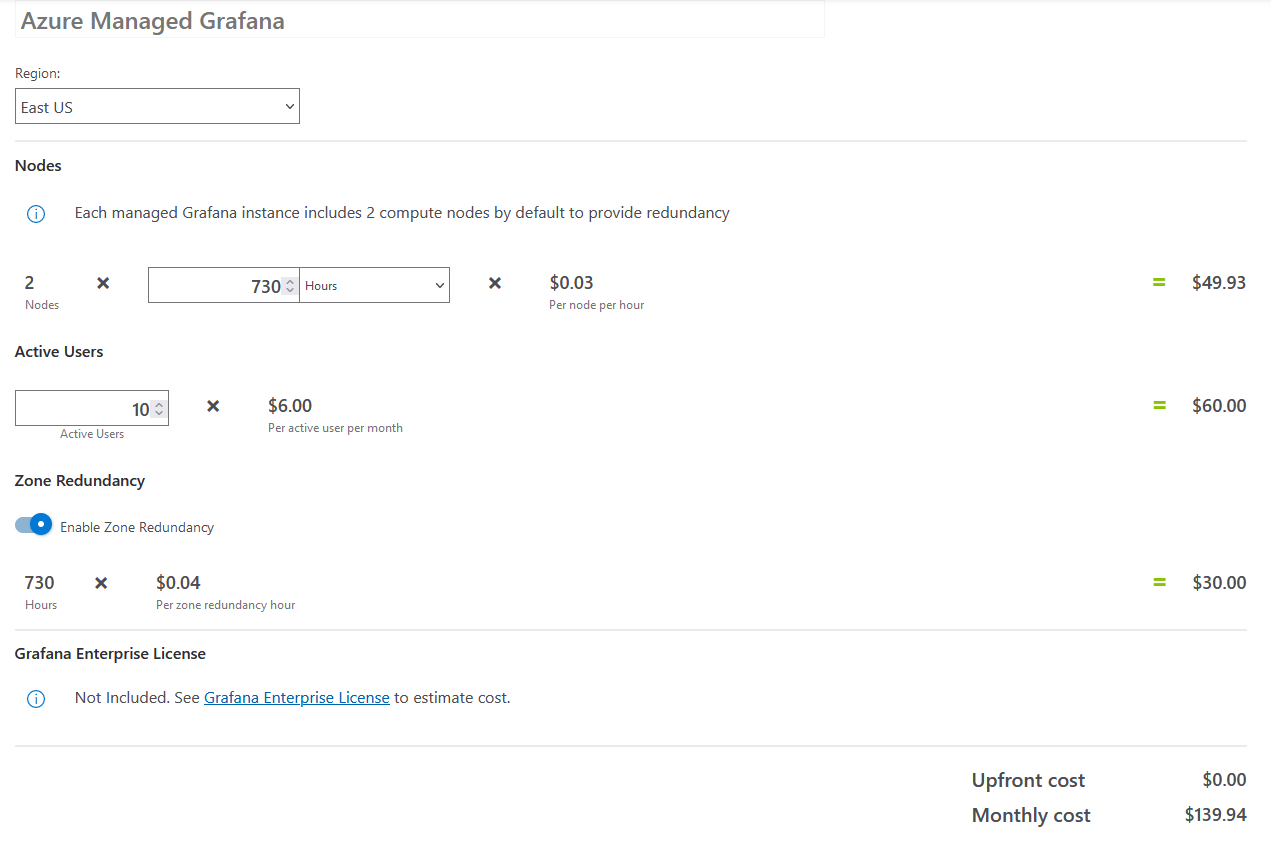
You can use the Azure pricing calculator to get an estimate of the cost of running managed Grafana.
As you will see, the price may start to stack up once you have a large number of active users:
Click on image to enlarge
Grafana Persistence
As we noted above Grafana does not support persistence by default. If you have not explicitly enabled persistence and the Grafana pod restarts you will lose all your configuration.
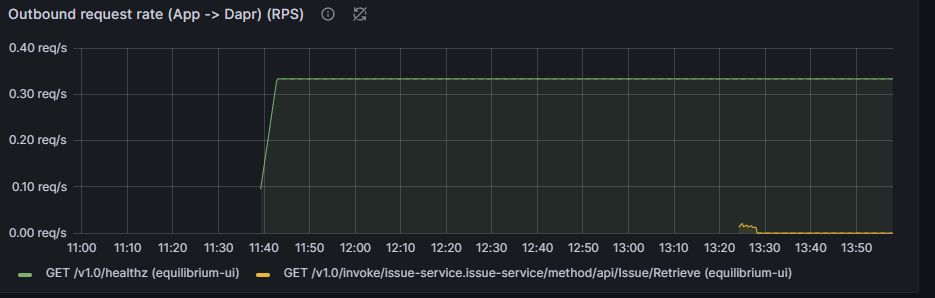
We can demonstrate this quite easily. Here is a graph of our outbound refresh rate:
Click on image to enlarge
We are viewing this at 2pm and have data going back to 11:40 am (which is when this grafana instance was started).
For the purposes of demonstration, we are now restart the Grafana pod. Hint - if you want to keep your configuration but have not yet implemented Grafana persistence then don't run this command.'
kubectl rollout restart deployment grafana -n dapr-monitoring
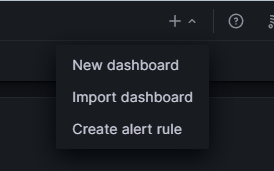
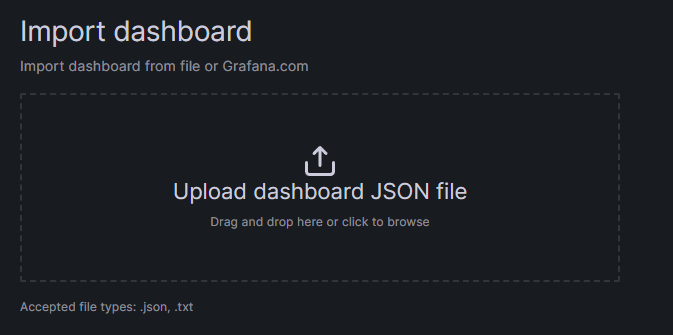
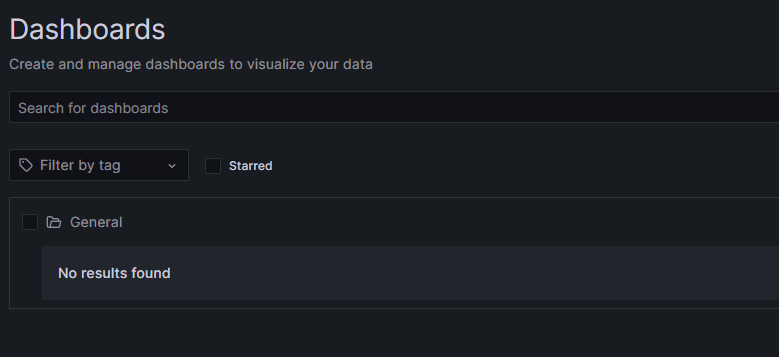
Once the pod restarts we will check our Grafana dashboard again:
Click on image to enlarge
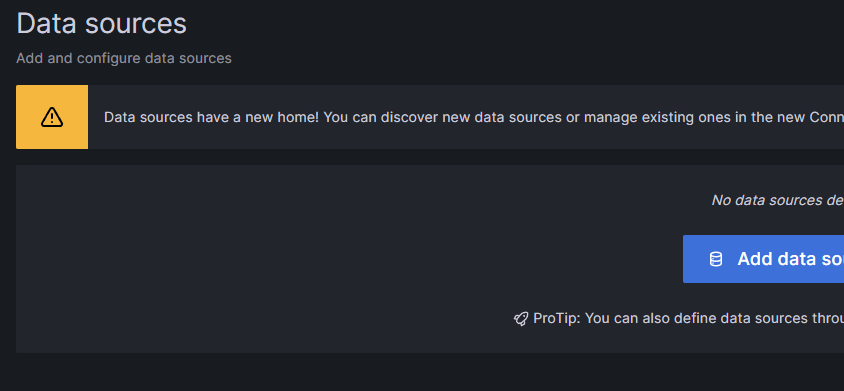
Nothing has been found! We have lost our dashboards and even our Data Source configurations. Obviously, if you have spent a lot of time hand-crafting or customising a dashboard you will want to avoid this kind of loss.
Click on image to enlarge
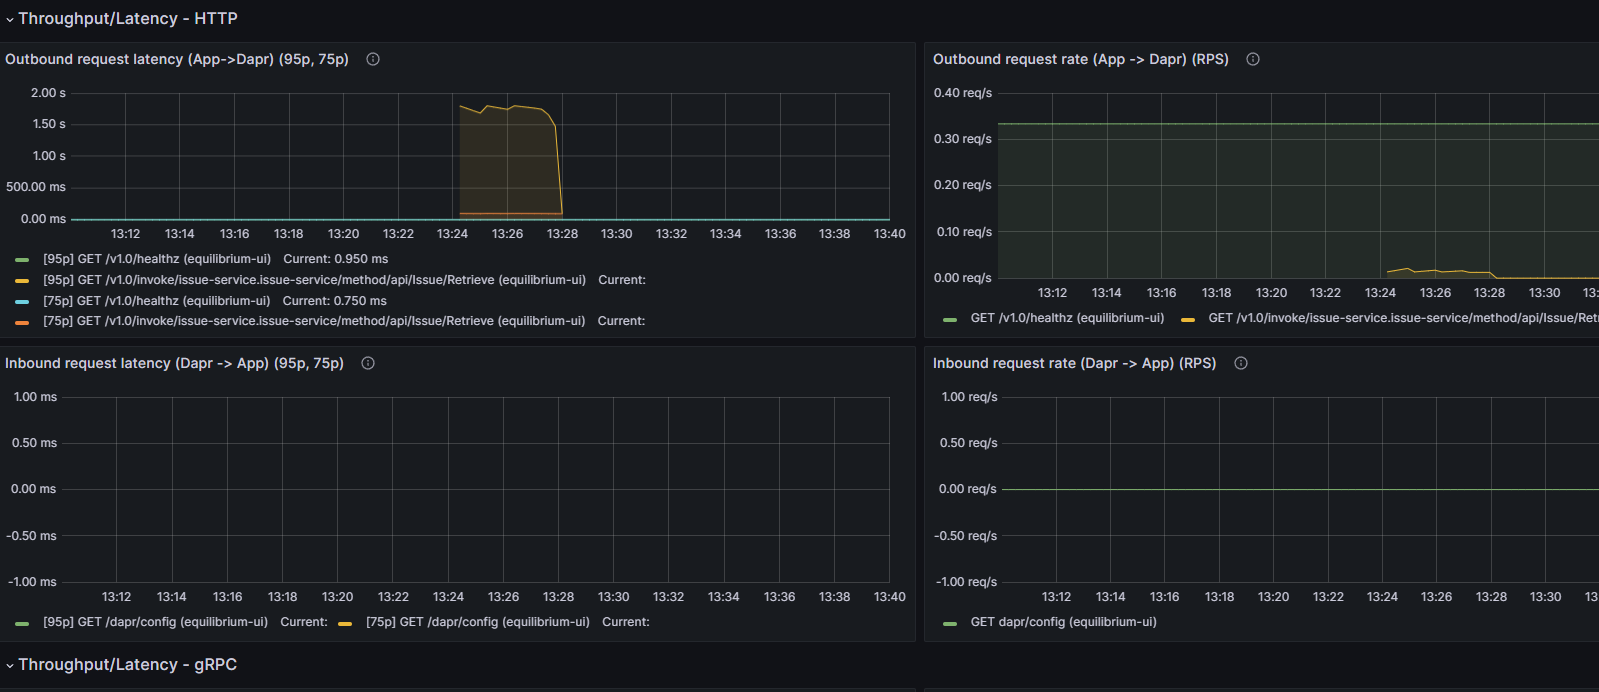
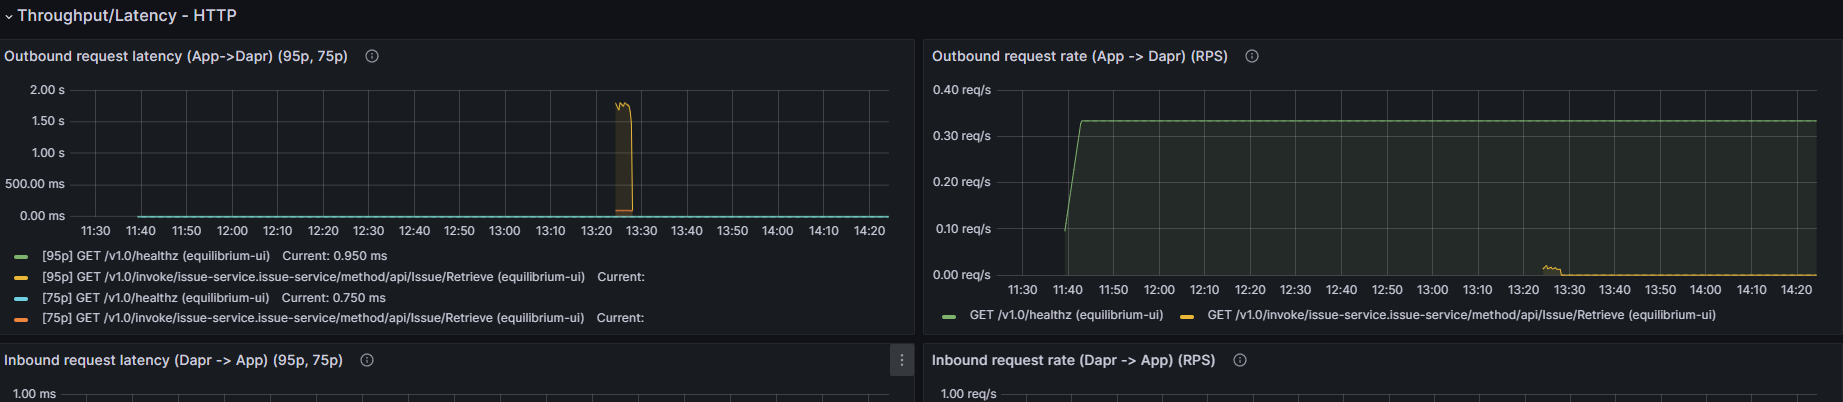
Once we restore the data source and the re-import the dashboards, we see our metrics again:
Click on image to enlarge
As you can see - we lost our Grafana configuration but we still have our metrics. This is because the metrics are stored on the Prometheus metrics server, which actually creates a persistent volume and persistent volume claim during its install.
Log Structure
Dapr emits structured logging. Each log entry has the following format:
| Field |
Description |
Example |
| time |
ISO8601 formatted timestamp |
2021-01-10T14:19:31.000Z |
| level |
Level of the entry (debug, info, warn, or error) |
info |
| type |
Log Type |
log |
| msg |
Log Message |
metrics server started on :62408/ |
| scope |
Logging Scope |
dapr.runtime |
| instance |
Hostname where Dapr runs |
TSTSRV01 |
| app_id |
Dapr App ID |
finecollectionservice |
| ver |
Dapr Runtime Version |
1.0 |
Log format
By default, Dapr will emit logs as plain text. While this is helpful in terms of huan readability, it is not so useful for automated parsing by logging tools.
To enable JSON formatting, you need to configure each Dapr sidecar. In self-hosted mode, you can specify the flag --log-as-json on the command line:
dapr run --app-id finecollectionservice --log-level info --log-as-json dotnet run
In Kubernetes, you can add a dapr.io/log-as-json annotation to each deployment for the application:
YAML
    annotations:
    dapr.io/enabled: "true"
    dapr.io/app-id: "finecollectionservice"
    dapr.io/app-port: "80"
    dapr.io/config: "dapr-config"
    dapr.io/log-as-json: "true"
When you install Dapr in a Kubernetes cluster using Helm, you can enable JSON formatted logging for all the Dapr system services:
    helm repo add dapr https://dapr.github.io/helm-charts/
    helm repo update
    kubectl create namespace dapr-system
    helm install dapr dapr/dapr --namespace dapr-system --set global.logAsJson=true
Collect Logs
So far we have configured Dapr to emit logs in json format. At the moment though, nothing is capturing those logs. There are three main components to the log management process:
One popular solution for these tasks is to use a combination of FluentD and the Elk Stack (Elastic Search and Kibana). We will explore this option later. There is however, an other (and arguably simpler option) available to AKS users and that is to utilise the Azure Container Insights feature.
Container Insights
This is the definition of Container Insights from the Microsoft Azure Monitor documentation
Container insights is a feature designed to monitor the performance of container workloads deployed to the cloud. It gives you performance visibility by collecting memory and processor metrics from controllers, nodes, and containers that are available in Kubernetes through the Metrics API. After you enable monitoring from Kubernetes clusters, metrics and Container logs are automatically collected for you through a containerized version of the Log Analytics agent for Linux. Metrics are sent to the metrics database in Azure Monitor. Log data is sent to your Log Analytics workspace.
Enabling Container Insights
In Azure you can enable Container Insights on a cluster by cluster basis. It is worth bearing in mind that Container insights is not simply a log collection tool - it also collects metrics.
There are two ways to enable Container Insights From the Azure Portal. You can either manage it globally via Azure Monitor, or within the configuration page for an individual cluster
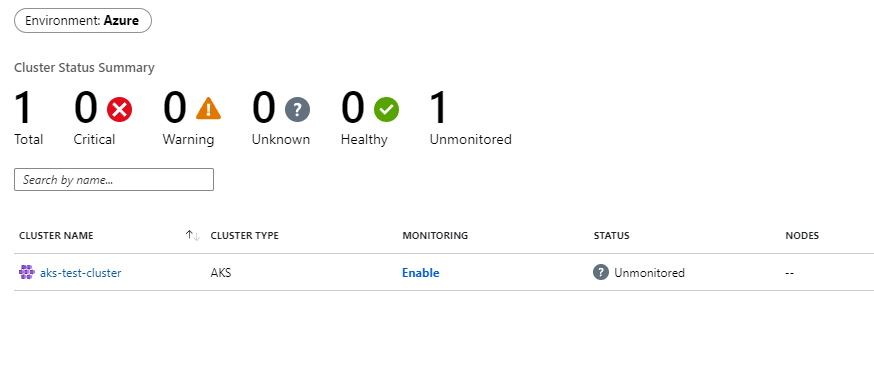
From the main side menu click on the Monitor option and then click on Containers and then on Unmonitored Clusters.
Click on image to enlarge
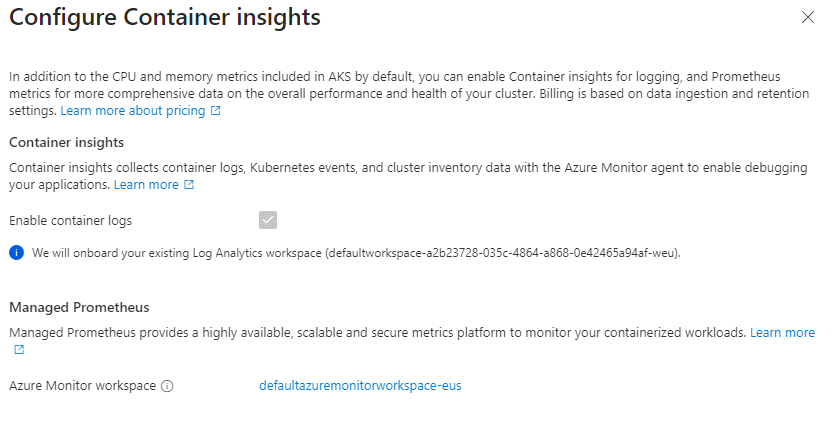
As you can see, we now have the option to enable monitoring. Once you click on the Enable link, you will see something interesting - when you enable Monitoring, Azure Monitor automatically provisions a Managed Prometheus instance for you:
Click on image to enlarge
You actually have no choice in this - Container Insights are built on Prometheus. Interestingly, whilst Azure Monitor will always create a Managed Prometheus instance, you can actually create a Managed Prometheus instance without enabling Container Insights.
There are a number of guides to configuring monitoring with Dapr which provide instructions for provisioning your own (unmanaged) Prometheus instance. If you already have Container Insights enabled then this is not only unnecessary but also, potentially, a waste of resources.
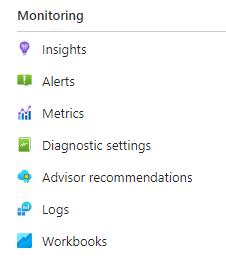
Once you click on the Configure button Azure Monitor will click of a process for 'onboarding' Container Insights. Container Insights will collect any logs sent to StdOut (it also collects logs from StdErr). As we have noted above, Dapr emits its logs to stdout by default so we do not need to carry out any further configuration to view the logs. Viewing the raw logs is simple. If you navigate to the overview page for your cluster in the Azure Portal you just need to click on the Logs option in the Monitoring section of the navigation pane:
Click on image to enlarge
You will see that there are a number of logging tables - the one we are interested in is ContainerLog. To view the data we will need to run a query. Azure Monitor queries are written in an intuitive, sql-like language called Kusto.
The following query will return all log entries for the last 30 minutes where the source is stdout:
let startTimestamp = ago(30m);
KubePodInventory
| where TimeGenerated > startTimestamp
| project ClusterName, ContainerID, PodName=Name, Namespace, ServiceName
| distinct ClusterName, ContainerID, PodName, Namespace, ServiceName
| join kind=inner
(
ContainerLog
| where TimeGenerated > startTimestamp
| where LogEntrySource == 'stdout' )
on ContainerID
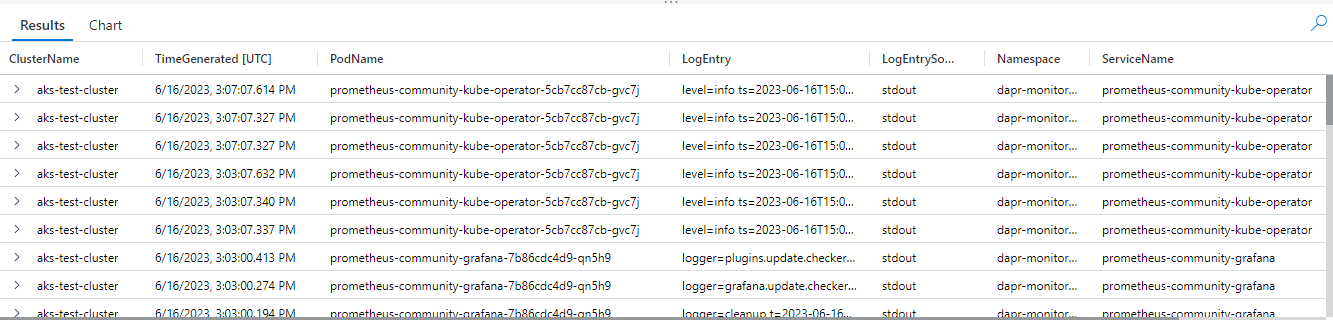
| project ClusterName, TimeGenerated, PodName, LogEntry, LogEntrySource, Namespace, ServiceName
| order by TimeGenerated desc
As you can see it uses SQL-like logic to join other tables so that we can retrieve useful data such as pod name, service name and the Kubernetes Namespace. Your output should look something like this:
Click on image to enlarge
We can then save this query so that we can re-use it. We can even pin it as a tile on a dashboard on the Azure Portal.
Disabling Container Insights
You can enable Container Insights from the Azure portal but you can only disable it from the Command Line. To do so you need to run the aks disable-addons command:
az aks disable-addons -a monitoring -n aks-test-cluster -g rg-akstest
FluentD/Elk Stack
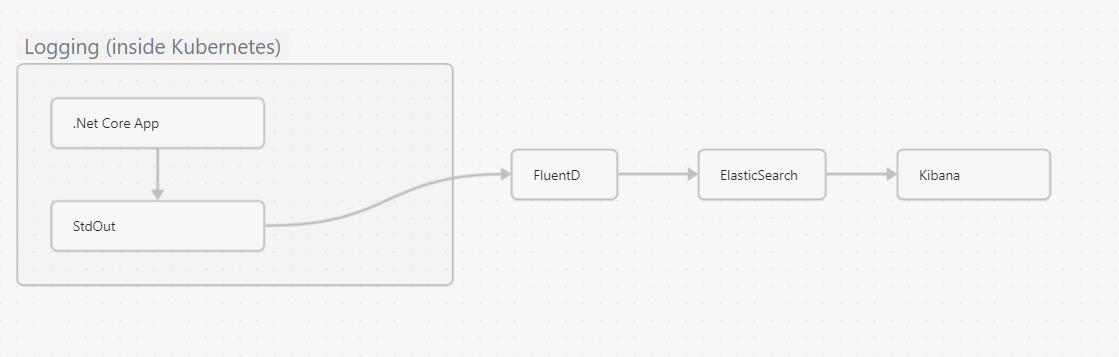
In the following section we will be using different tools to fulfil each of these functions. These will be:
Fluentd - capture
Elasticsearch - storage
Kibana - viewing
Click on image to enlarge
Fluentd is a popular tool for log capture - its pluggable model makes it both powerful and highly versatile.
The text below is taken from the official Dapr documentation:
https://docs.dapr.io/operations/monitoring/logging/fluentd/
Installing Fluentd
Download these config files:
Note: If you already have Fluentd running in your cluster, please enable the nested json parser so that it can parse JSON-formatted logs from Dapr.
Apply the configurations to your cluster:
    kubectl apply -f ./fluentd-config-map.yaml

    kubectl apply -f ./fluentd-dapr-with-rbac.yaml
These files will install resources into the Kube-system namespace. The number of FluentD instances should be the same as the number of cluster nodes. In the example below, there is only one node in the cluster:
    $ kubectl get pods -n kube-system -w
    NAME                          READY   STATUS    RESTARTS   AGE
    coredns-6955765f44-cxjxk      1/1     Running   0          4m41s
    coredns-6955765f44-jlskv      1/1     Running   0          4m41s
    etcd-m01                      1/1     Running   0          4m48s
    fluentd-sdrld                 1/1     Running   0          14s
Now install Elastic search and Kibana
It is worth bearing in mind that ElasticSearch is a relatively resource hungry application. We are using version 7.17.3 which has the following resource specification in its Helm chart:
    resources:
        requests:
        cpu: "1000m"
        memory: "2Gi"
        limits:
        cpu: "1000m"
        memory: "2Gi"
Two GB of memory and an entire cpu core is a reasonable chunk of resources - especially in a non-prod environment. It is probably worth checking your cluster capacity before you install. If you do not have enough resources on your cluster the Helm install will succeed but the ElasticSearch containers will be unable to start.
You can, of course, try tweaking the resources specification. The following specification worked in a two node cluster running on a Standard_D4s_v3 VM ScaleSet.
    resources:
        requests:
        cpu: "500m"
        memory: "1Gi"
        limits:
        cpu: "500m"
        memory: "1Gi"
Obviously, this is a development configuration and is not advised for production environments.
From Dapr docs web site:
Add the helm repo for Elastic Search
    helm repo add elastic https://helm.elastic.co

    helm repo update
Install Elastic Search using Helm
By default, the chart creates 3 replicas which must be on different nodes. If your cluster has fewer than 3 nodes, specify a smaller number of replicas. For example, this sets the number of replicas to 1:
helm install elasticsearch elastic/elasticsearch --version 7.17.3 -n dapr-monitoring --set replicas=1
Otherwise:
helm install elasticsearch elastic/elasticsearch --version 7.17.3 -n dapr-monitoring
If you are using minikube or simply want to disable persistent volumes for development purposes, you can do so by using the following command:
helm install elasticsearch elastic/elasticsearch --version 7.17.3 -n dapr-monitoring --set persistence.enabled=false,replicas=1
Next install Kibana
helm install kibana elastic/kibana --version 7.17.3 -n dapr-monitoring
Finally - ensure that Elastic Search and Kibana are running on your cluster:
    $ kubectl get pods -n dapr-monitoring
    NAME                            READY   STATUS    RESTARTS   AGE
    elasticsearch-master-0          1/1     Running   0          6m58s
    kibana-kibana-95bc54b89-zqdrk   1/1     Running   0          4m21s
Now we can search our logs.Port-forward from localhost to the kibana-kibana service
    $ kubectl port-forward svc/kibana-kibana 5601 -n dapr-monitoring
    Forwarding from 127.0.0.1:5601 -> 5601
    Forwarding from [::1]:5601 -> 5601
    Handling connection for 5601
    Handling connection for 5601
You will be prompted to login.
Once you have logged in, follow these steps:
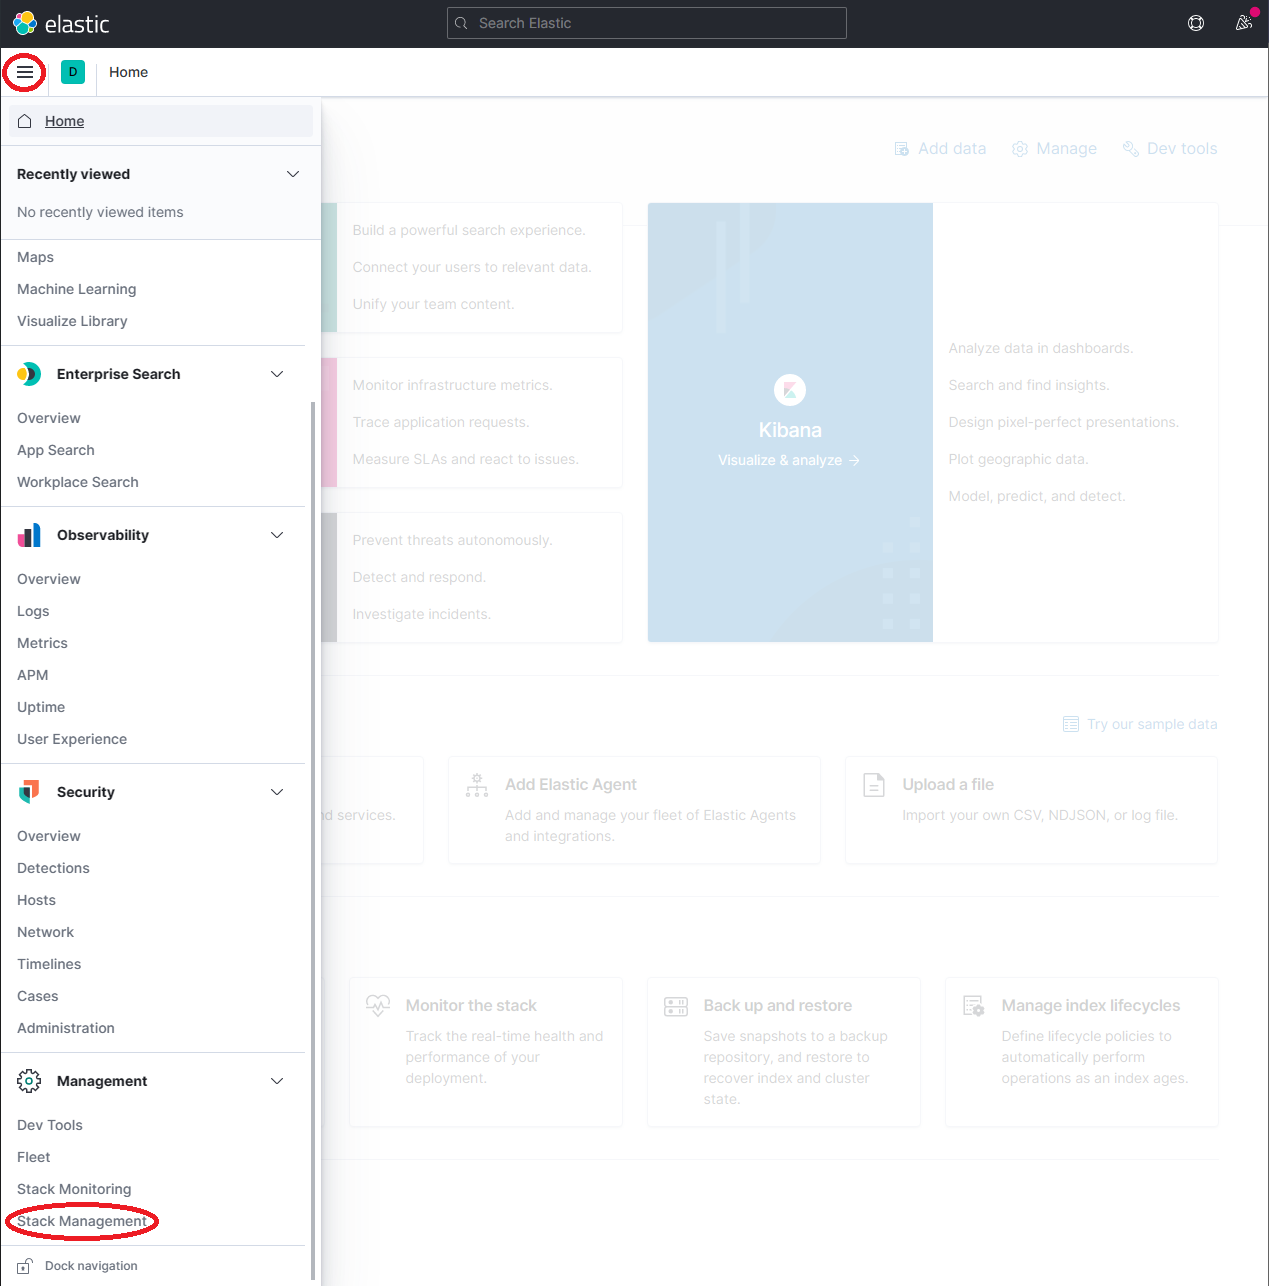
-
Expand the drop-down menu and click Management → Stack Management
Click on image to enlarge
-
On the Stack Management page, select Data → Index Management and wait until dapr-* is indexed.
Click on image to enlarge
The 'dapr-' index
You may be wondering how the 'dapr-' index got created - it is not something we have manually configured in ElasticSearch. The answer is that it was defined in the FluentD configuration that we applied earlier. It is created by this this line
index_name "#{ENV['FLUENT_ELASTICSEARCH_LOGSTASH_INDEX_NAME'] || 'dapr'}"
of our fluentd-config-map.yaml file. In some ways assigning the name 'dapr' to the index may be a little misleading. This index will contain all logs sent to stdout by containers, not just those emitted by Dapr-enabled services.
If you are not familiar with the Elk stack then the term 'index' may need some clarification. If you have familiarity with relational databases then you will be familiar with the concept of an index as an ordered lookup table pointing to rows in a table. In the Elk stack, an Index represents a table itself.
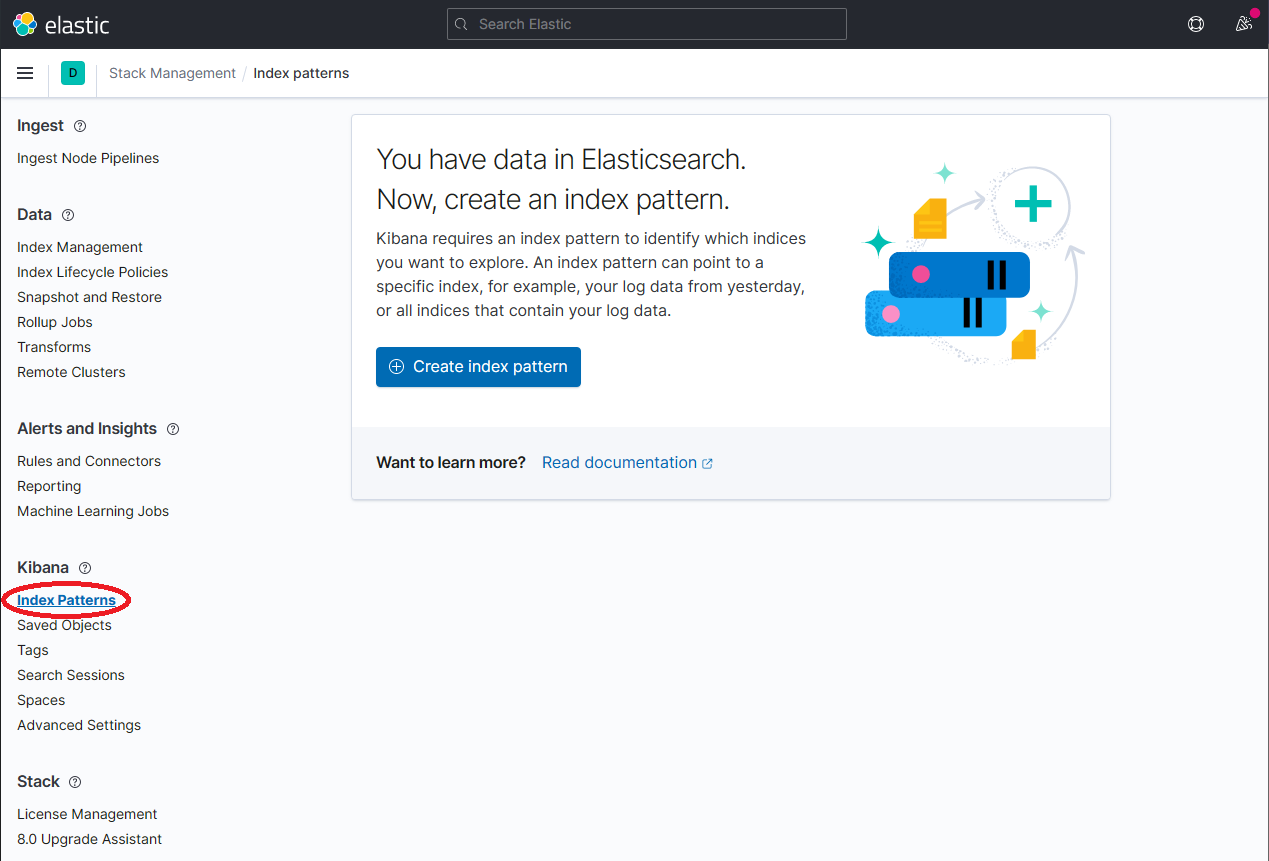
-
The index itself is an entity which is internal to the ElasticSearch component. If we want to surface the logs in Kibana we now need to create an 'Index Pattern'. The Index Pattern functions of a kind of mapping which explains to tools such as Kibana how the data in the index can be interpreted. Once dapr-* is indexed, click on Kibana → Index Patterns and then the Create index pattern button.
Click on image to enlarge
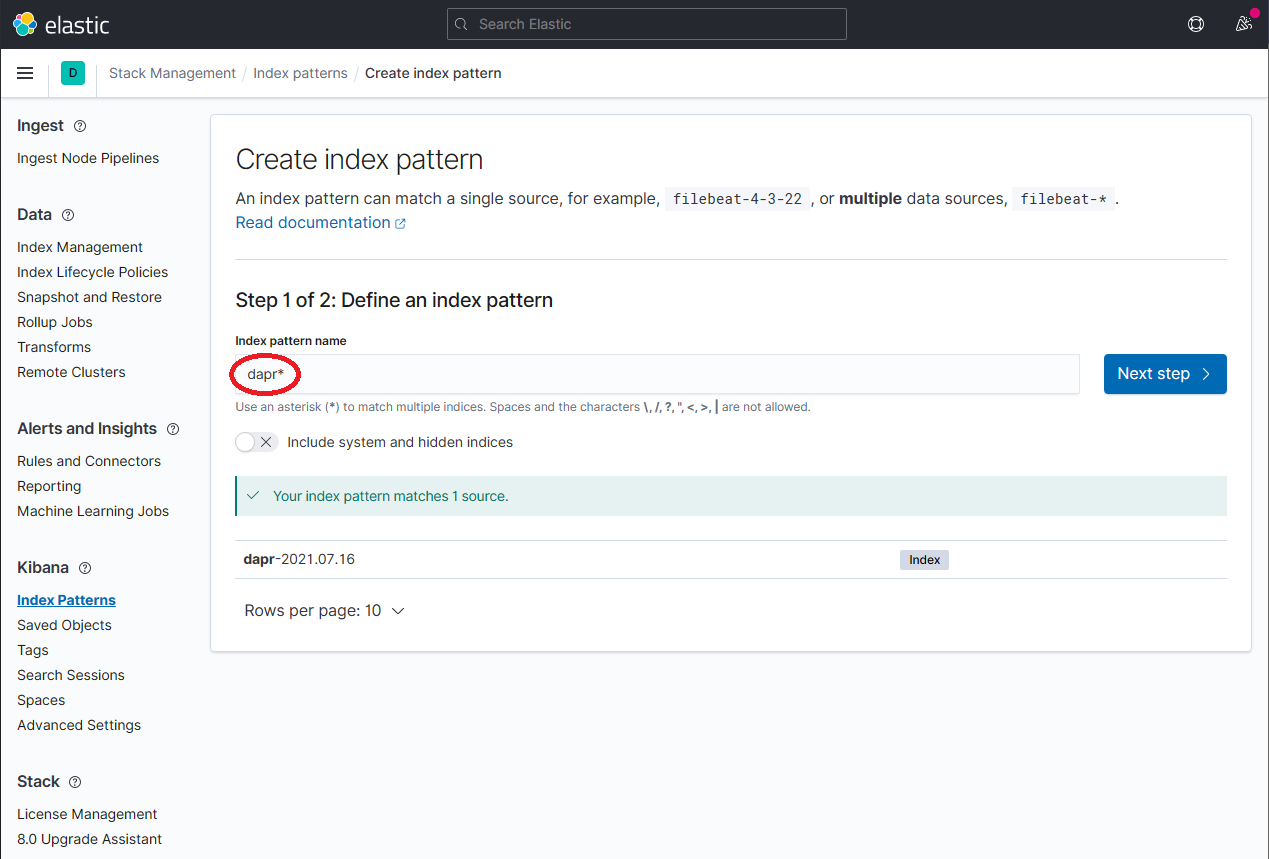
-
Define a new index pattern by typing dapr* into the Index Pattern name field, then click the Next step button to continue.
Click on image to enlarge
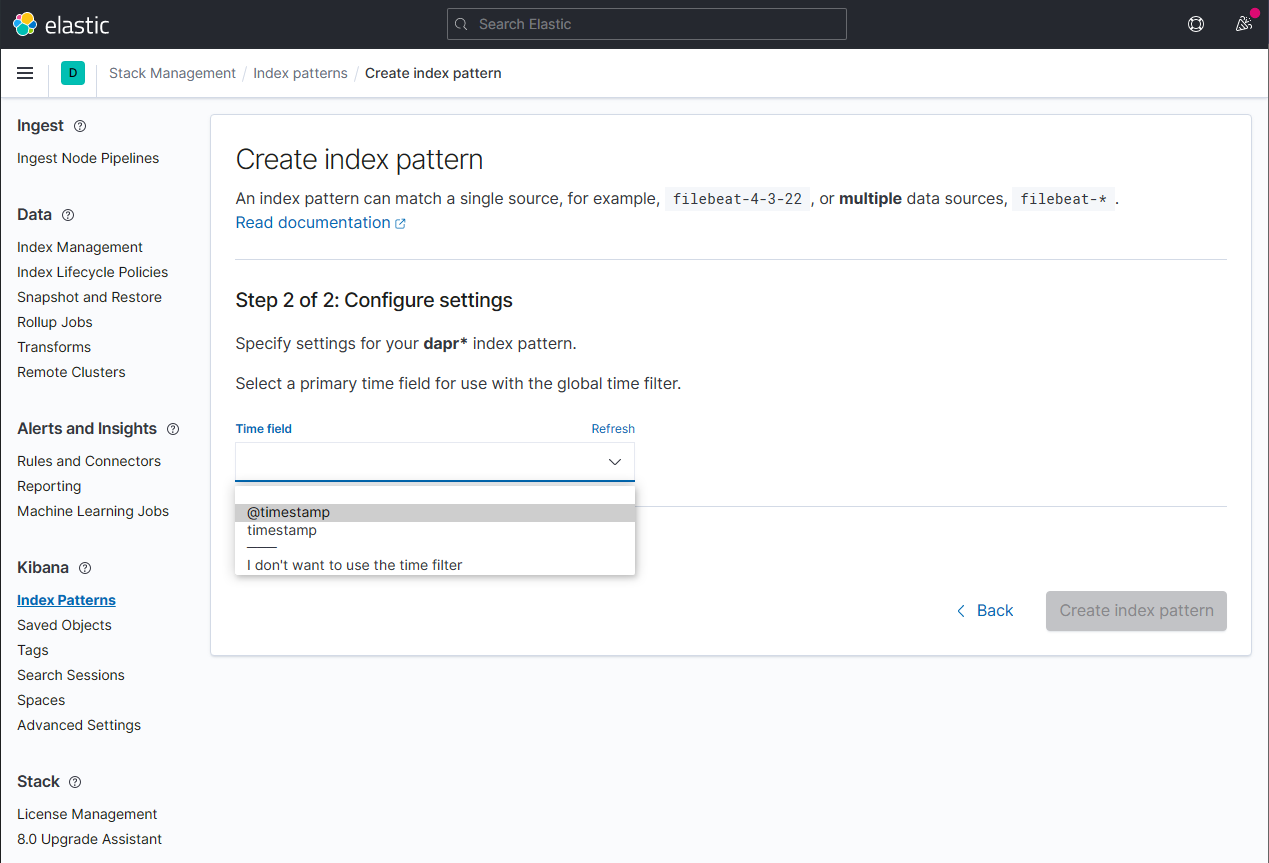
-
Configure the primary time field to use with the new index pattern by selecting the @timestamp option from the Time field drop-down. Click the Create index pattern button to complete creation of the index pattern.
Click on image to enlarge
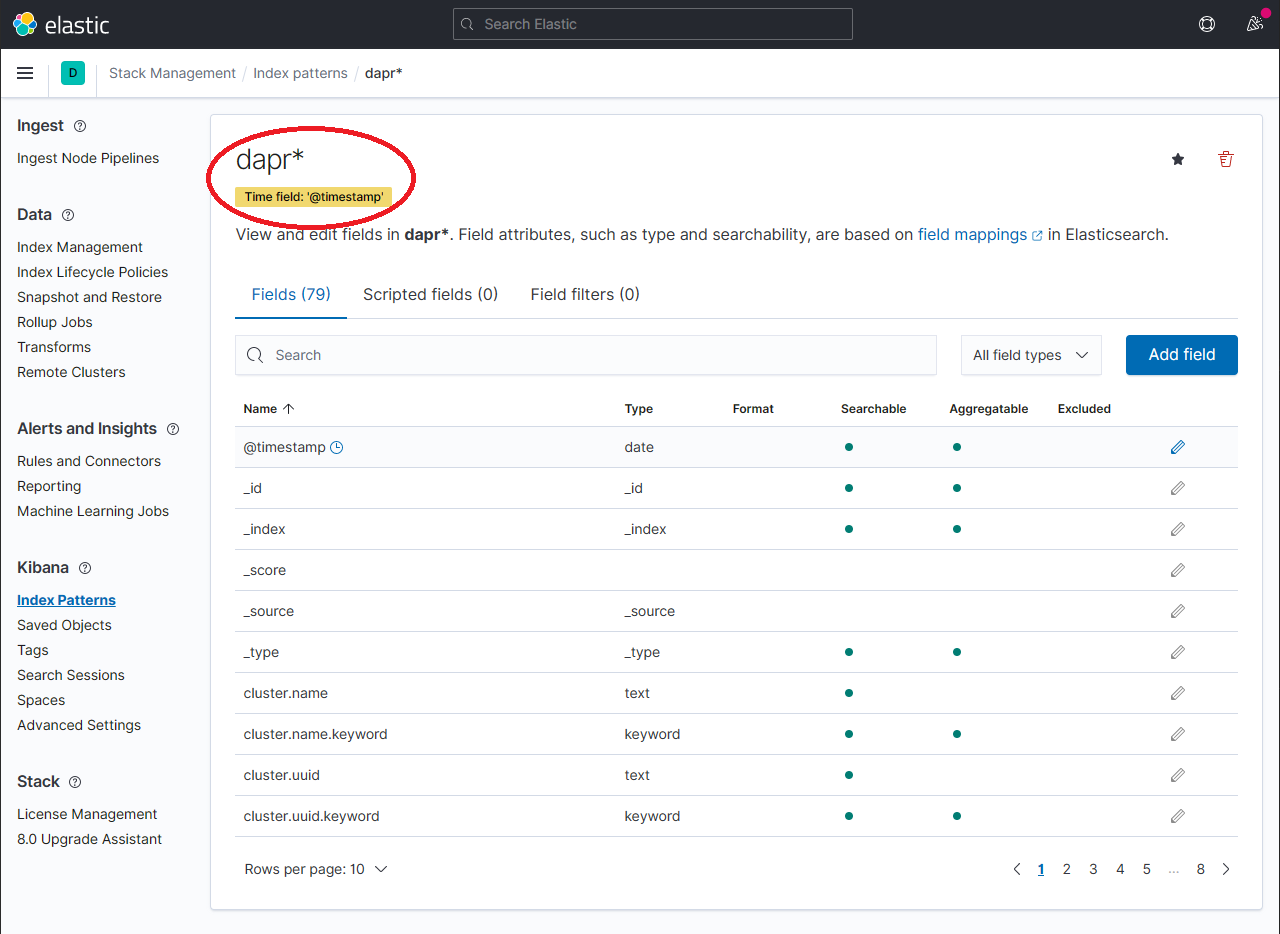
-
The newly created index pattern should be shown. Confirm that the fields of interest such as scope, type, app_id, level, etc. are being indexed by using the search box in the Fields tab.
Note: If you cannot find the indexed field, please wait. The time it takes to search across all indexed fields depends on the volume of data and size of the resource that the elastic search is running on.
Click on image to enlarge
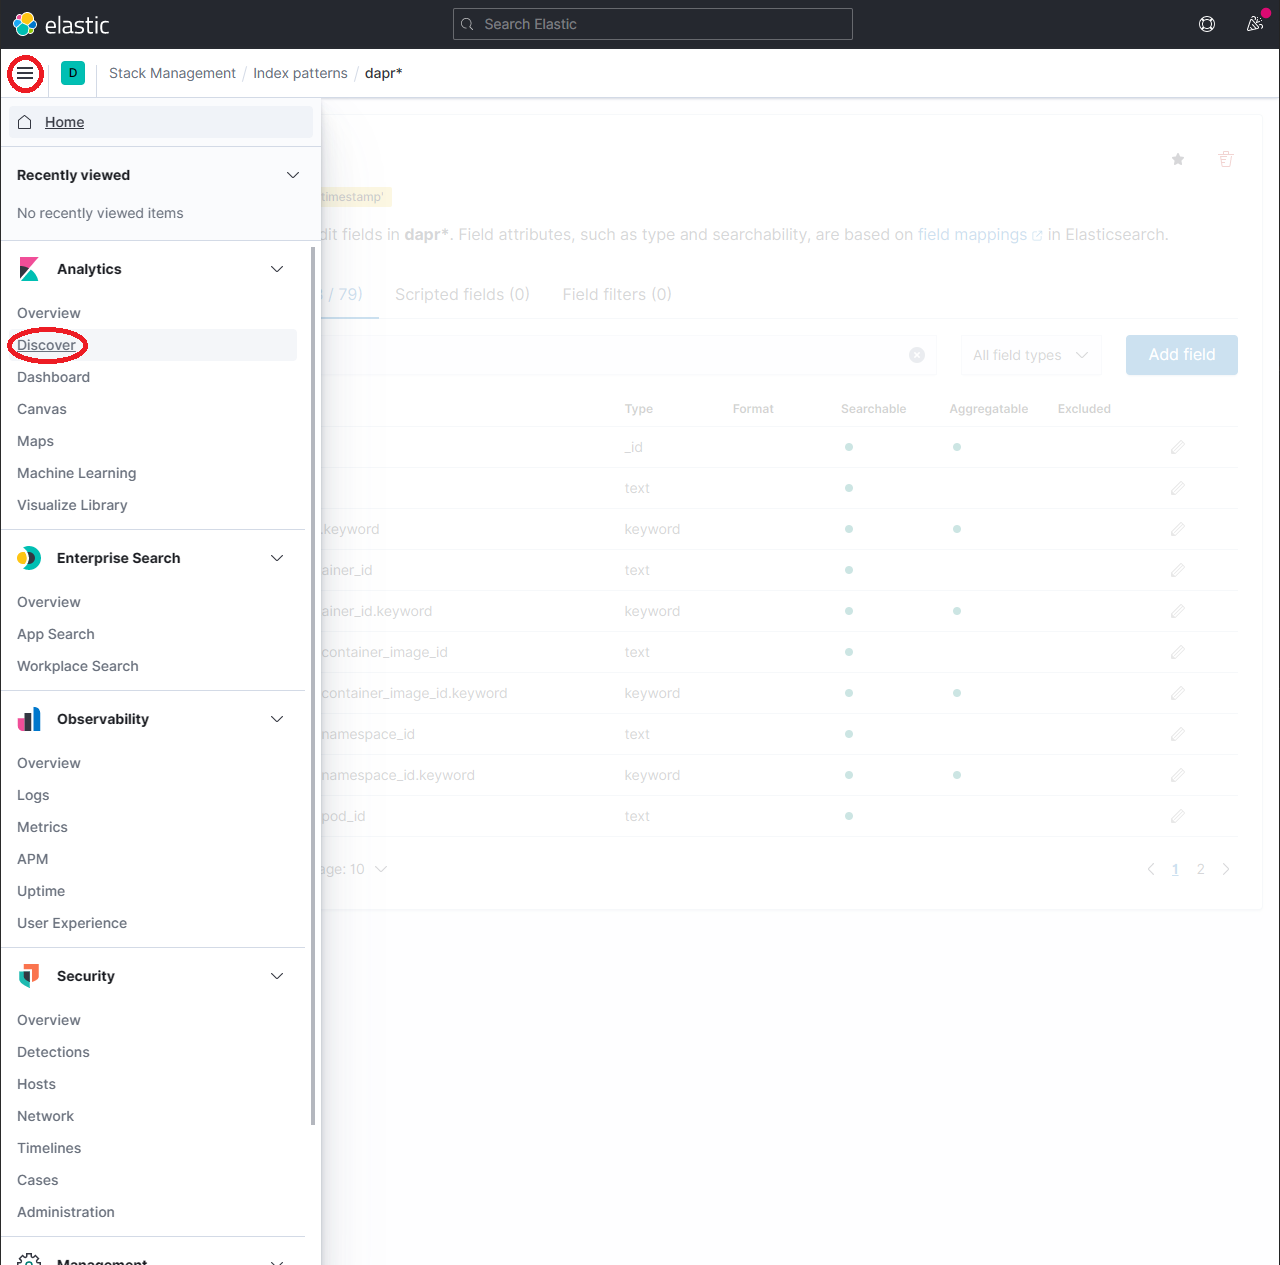
-
To explore the indexed data, expand the drop-down menu and click Analytics → Discover.
Click on image to enlarge
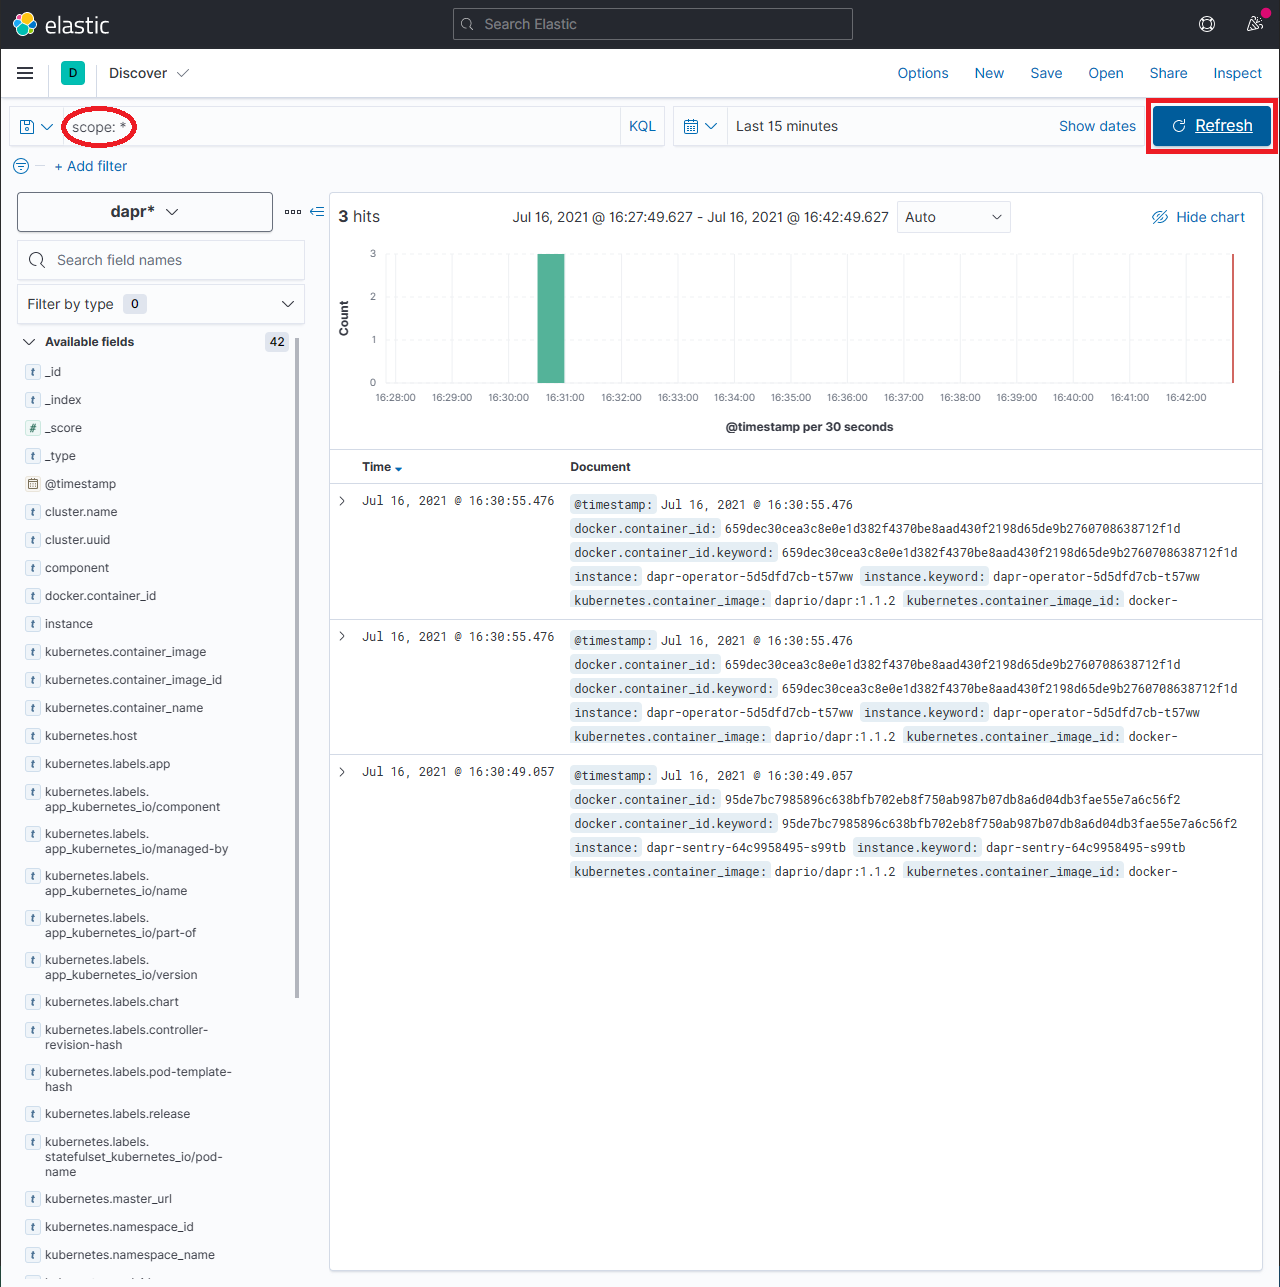
-
In the search box, type in a query string such as scope:* and click the Refresh button to view the results.
Note: This can take a long time. The time it takes to return all results depends on the volume of data and size of the resource that the elastic search is running on. It can take an hour or more before your logs become visible so don't be too alarmed if you are not seeing any log data.
Click on image to enlarge
How It Hangs Together
This is great - we have the logs from our containers being captured by FluentD, then sent to ElasticSearch and Kibana for storage and viewing. How can this happen when we just deployed some Helm charts without any specific configuration to integrate these different moving parts.
The first link in the chain is our logs. Logs emitted by Dapr are sent to the Dapr sidecar's stdout and stderr outputs. Equally, if you are using the net ILogger component this will automatically send logs to the same targets when running in a Linux container.
So we have logs being emitted to stdout and stderr. How does FluentD capture them? Well, Kubernetes provides a native logging mechanism called Cluster-level Logging Architecture. It allows for log aggregation and forwarding from containers to various logging backends, including FluentD. Kubernetes achieves this by redirecting container logs from STDOUT and STDERR to a logging agent, which then forwards the logs to the desired log destination.
FluentD is deployed as a DaemonSet, which ensures that an instance of FluentD runs on each node in the Kubernetes cluster. The FluentD DaemonSet collects logs from all the containers running on the node.
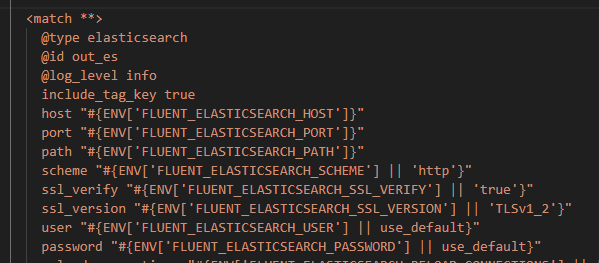
The next question then is how did our logs get forwarded from FluentD to ElasticSearch. The logic for this is actually embedded in the fluentd-config-map.yaml file we deployed earlier:
Click on image to enlarge
The file contains a 'match' section which defines the configuration for forwarding logs to an ElasticSearch receiver. The host and port are injected as environment variables.
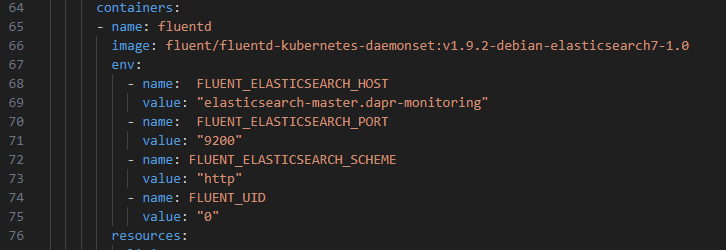
These environment variables are in turn defined in the 'fluentd-dapr-with-rbac.yaml' we deployed:
Click on image to enlarge
You can, of course add further 'match' sections to forward logs on to other destinations.
ElasticSearch
A Caveat
ElasticSearch has now been archived by the Elastic organisation. The final version to be released was ElasticSearch 8.5.1. The recommendation going forward is to to use the Elastic Cloud on Kubernetes if you are running the Elastic Stack on a Kubernetes platform: https://github.com/elastic/cloud-on-k8s. From the ElasticSearch Github Helm Chart page:
https://github.com/elastic/helm-charts/tree/main/elasticsearch
This Helm chart is a lightweight way to configure and run our official Elasticsearch Docker image
Warning When it comes to running the Elastic on Kubernetes infrastructure, we recommend Elastic Cloud on Kubernetes (ECK) as the best way to run and manage the Elastic Stack.
ECK offers many operational benefits for both our basic-tier and our enterprise-tier customers, such as spinning up cluster nodes that were lost on failed infrastructure, seamless upgrades, rolling cluster changes, and much much more.
With the release of the Elastic Stack Helm charts for Elastic version 8.5.1, we are handing over the ongoing maintenance of our Elastic Stack Helm charts to the community and contributors. This repository will finally be archived after 6 months time. Elastic Stacks deployed on Kubernetes through Helm charts will still be fully supported under EOL limitations.
Since we want to provide an even better experience for our customers by running the Elastic Stack on Kubernetes, we will continue maintaining the Helm charts applicable to ECK Custom Resources. These charts can be found in the ECK repository.
Helm charts will currently be maintained for ECK Enterprise-tier customers, however, we encourage the community to engage with the existing Helm charts for the Elastic Stack and continue supporting their ongoing maintenance.