

We all know the shape of the observability cost crisis – exponentially increasing telemetry volumes resulting in massive spikes in cost for ingestion and storage, as well as the huge engineering challenge of running performant queries over vast data sets.
OpenObserve’s solution to this is an architectural one - stop building an index over everything you ingest and store the raw data as compressed columnar files on object storage instead. Naturally, there are trade-offs, but the simplicity and performance gains mean that OpenObserve is a solution that demands a closer look.
OpenObserve was founded by Prabhat Sharma, who spent close to five years as a Solutions Architect at AWS before founding Zinc Labs in April 2022. The company's first product was ZincSearch, a lightweight Elasticsearch alternative that picked up several thousand GitHub stars and a $3.6m seed round led by Nexus Venture Partners.
OpenObserve is Prabhat’s second big project and it is also one that seems to have resonated with the market. OpenObserve is now used by more than 9,000 organisations. It has also gained traction in the community, and its open-source repository has more than 21,000 GitHub stars.
In April 2026 the company raised $10m in Series A funding, again led by Nexus Venture Partners alongside Dell Technologies Capital, timed to coincide with the launch of what it calls "Observability 3.0" — a set of AI-native additions to the platform.
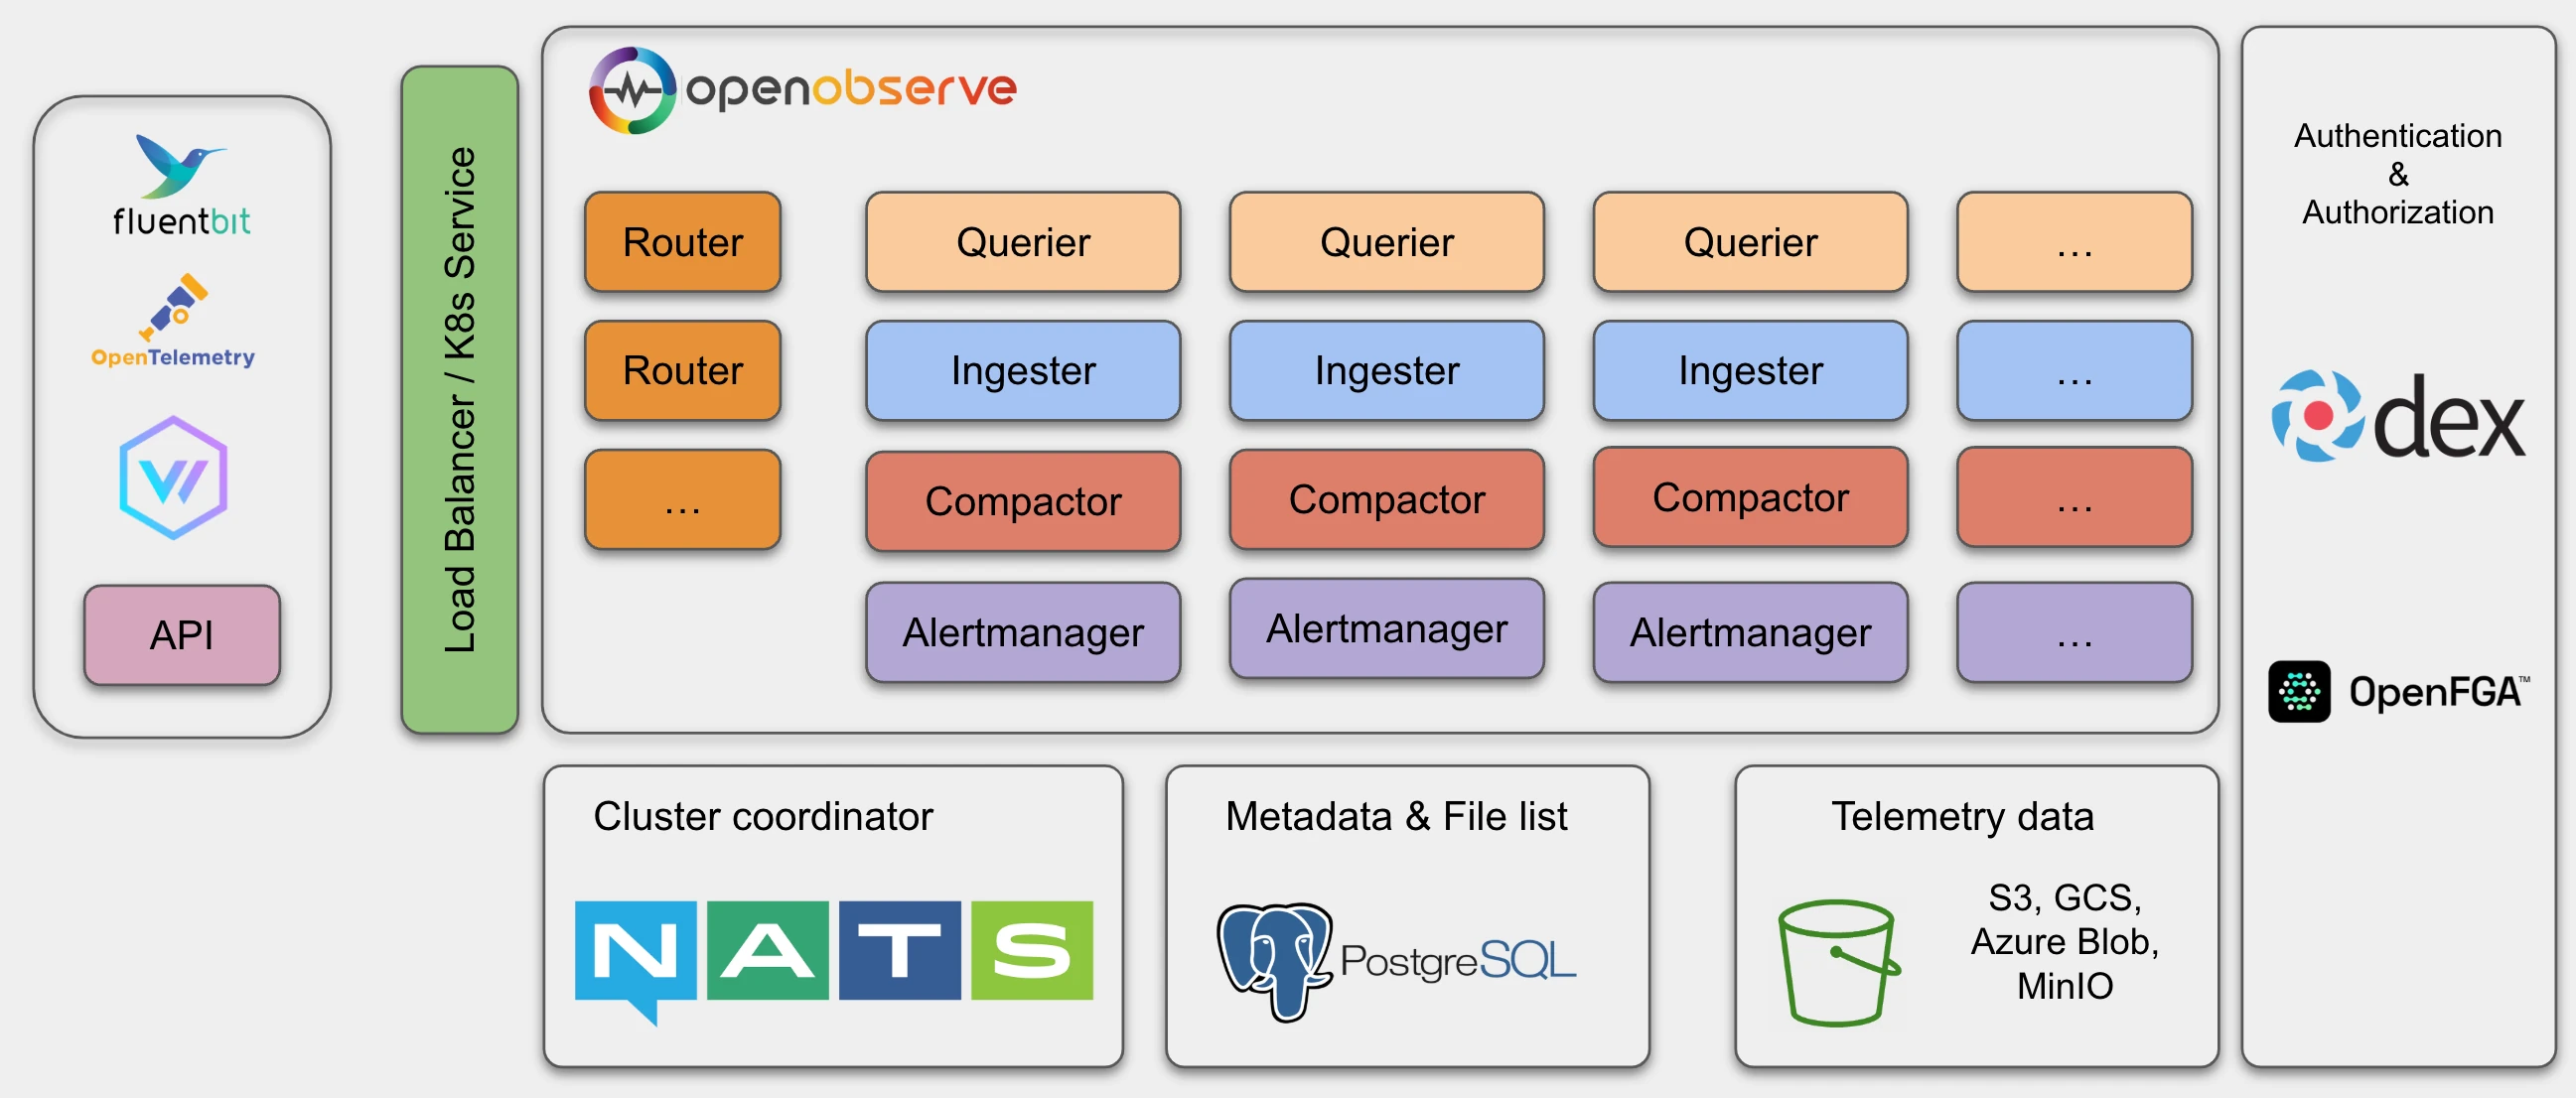
OpenObserve's design rests on three related decisions, each of which bring benefits for cost, performance and operability:
Unified signal storage: Logs, metrics, traces, real user monitoring, session replay and LLM/AI telemetry are all stored in the same underlying format, queried through the same engine, and presented in the same UI.
Stateless by design:
With the exception of ingester nodes, which briefly buffer incoming data, none of OpenObserve's components hold state. Routers, compactors, queriers and schedulers can all be killed and restarted without data loss, because durability comes entirely from the object store underneath them.
Open standards first:
Metrics are queried in PromQL, and logs and traces are queried in standard SQL. Ingestion is OpenTelemetry-native over OTLP, and the ingestion API also speaks Elasticsearch's _bulk protocol.
One of OpenObserve’s headline claims is that it is up to 140x lower on storage cost than Elasticsearch. The mechanism for achieving this is straightforward. Instead of building and maintaining an inverted index over every field of every document, OpenObserve writes ingested data as Apache Parquet - a compressed, columnar file format - directly to S3, GCS, Azure Blob or MinIO.
Performance-wise, a single OpenObserve node can sustain roughly 7–30MB/sec throughput per vCPU core, and OpenObserve claims a modest single-node deployment on affordable hardware (an Apple M2, in their own testing) can ingest around 2.6TB of data a day.
OpenObserve scales its architectural complexity to match the demands of your environment. The simplest option is a single-binary deployment capable of ingesting and searching well over 2TB a day on one machine — sufficient for many small production workloads.
A middle option keeps the single-node simplicity but points storage at S3, GCS or Azure Blobs instead of local disk, trading a little query latency for the durability of object storage without taking on the overhead of a cluster.
At the top end of the scale is the high-availability deployment option: this consists of five node types — Router, Ingester, Compactor, Querier and Scheduler — each independently scalable, coordinated by NATS, backed by PostgreSQL for metadata and object storage for the actual data. Naturally, for this configuration you will need to get down in the weeds of Kubernetes and Helm. However, the fact that none of the compute layers holds durable state means that scaling out is largely a matter of just "add more replicas”.
Layered on top of the open-source core is OpenObserve Enterprise, which is free for up to 50GB/day of ingestion and includes the typical enterprise governance layer: SSO and RBAC, cipher keys for HIPAA and PCI workloads, extended retention and audit trailing.
Having a high-performance storage engine is great, but engineering teams also need low-friction ways of actually getting data into the system. This is an area where OpenObserve's OpenTelemetry-first positioning pays off. Ingestion natively supports OTLP over both HTTP and gRPC, Prometheus remote-write, the Loki push API and, as we previously mentioned, an Elasticsearch-compatible endpoint. Obviously, there is support for OpenTelemetry as well as Vector, Fluent Bit, Telegraf, Kinesis Firehose and syslog. There is even an option for for eBPF-based zero-code instrumentation.
The company has recently invested heavily in its AI capabilities. There are now integrations for over thirty agent frameworks (including LangChain, CrewAI, LlamaIndex and AutoGen), the major model providers (OpenAI, Anthropic, Gemini, Mistral, Ollama), AI gateways such as Portkey, LiteLLM and OpenRouter, and no-code builders such as n8n and Flowise.
It goes without saying that OpenObserve has full support for ingesting, viewing, querying and dashboarding of logs, metrics and traces, so we won’t dwell on those features. As well as the basics, OpenObserve also supports easy and performant correlation between signals. We will, however, just touch on a couple of features that caught our eye.
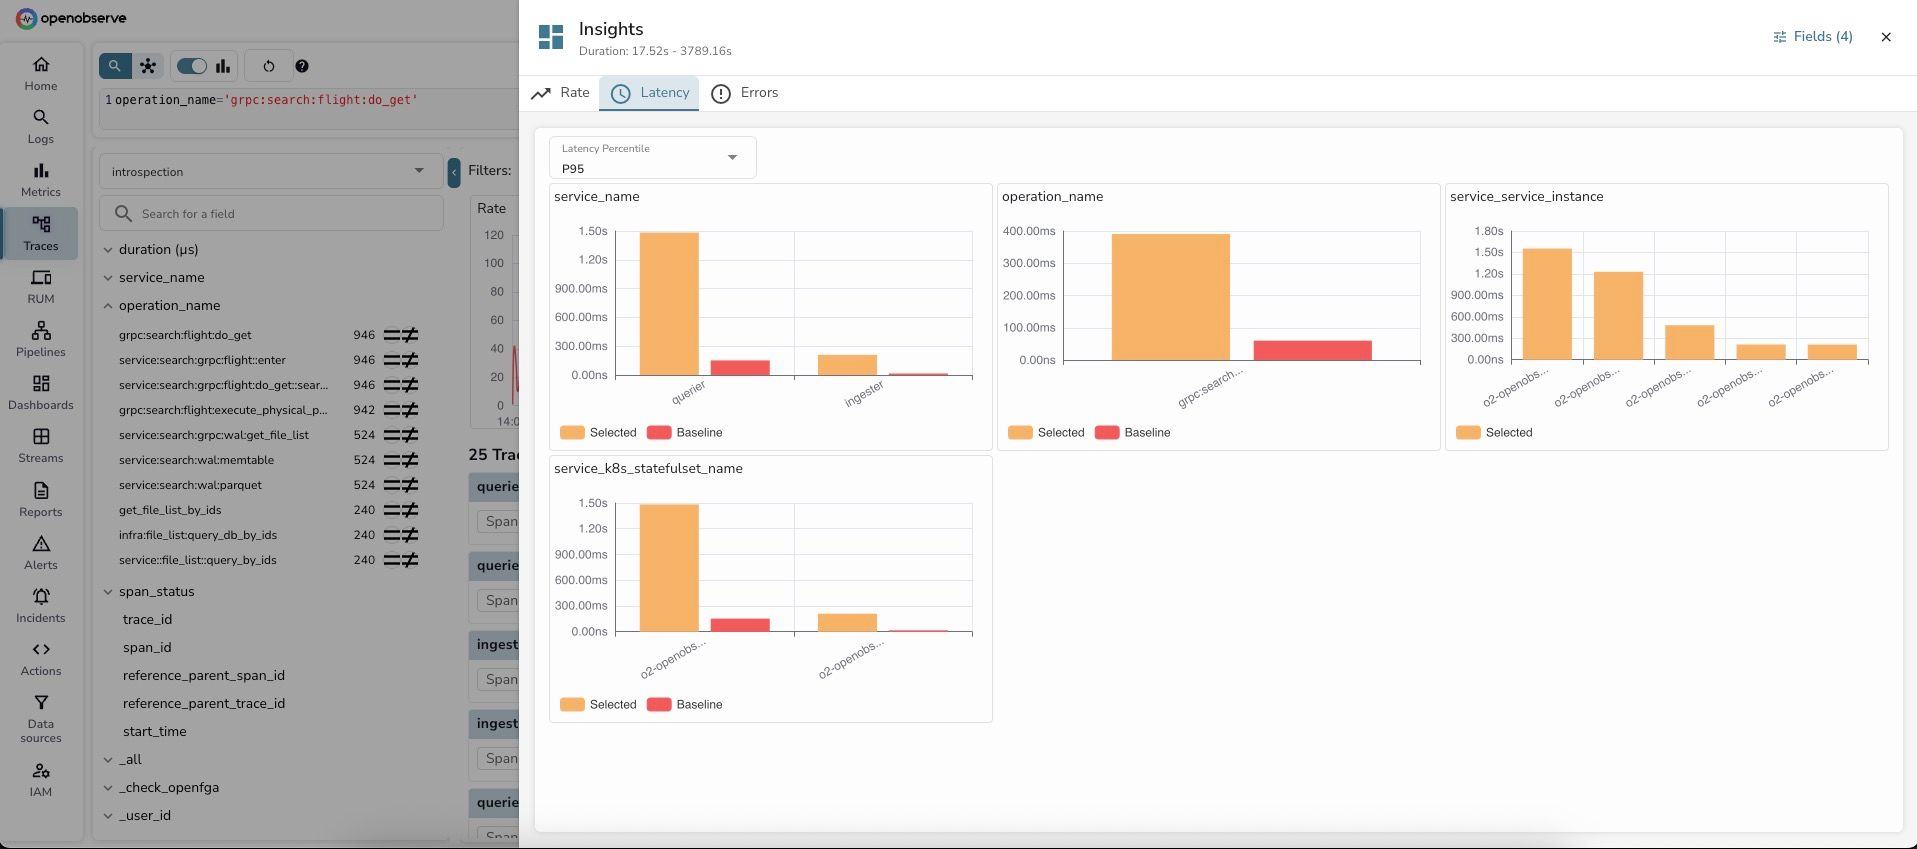
First up is Log Patterns. These automatically analyse your log data and group similar messages into a smaller set of recurring templates. The parts of a message that stay the same across many logs form the template text, and the parts that change from log to log are replaced with wildcard tokens such as <*>. This lets you understand the shape of high-volume log streams without reading every individual line. Insights, meanwhile, is an interactive dimension analysis feature that automates root cause identification by comparing data samples against baselines across multiple dimensions simultaneously.
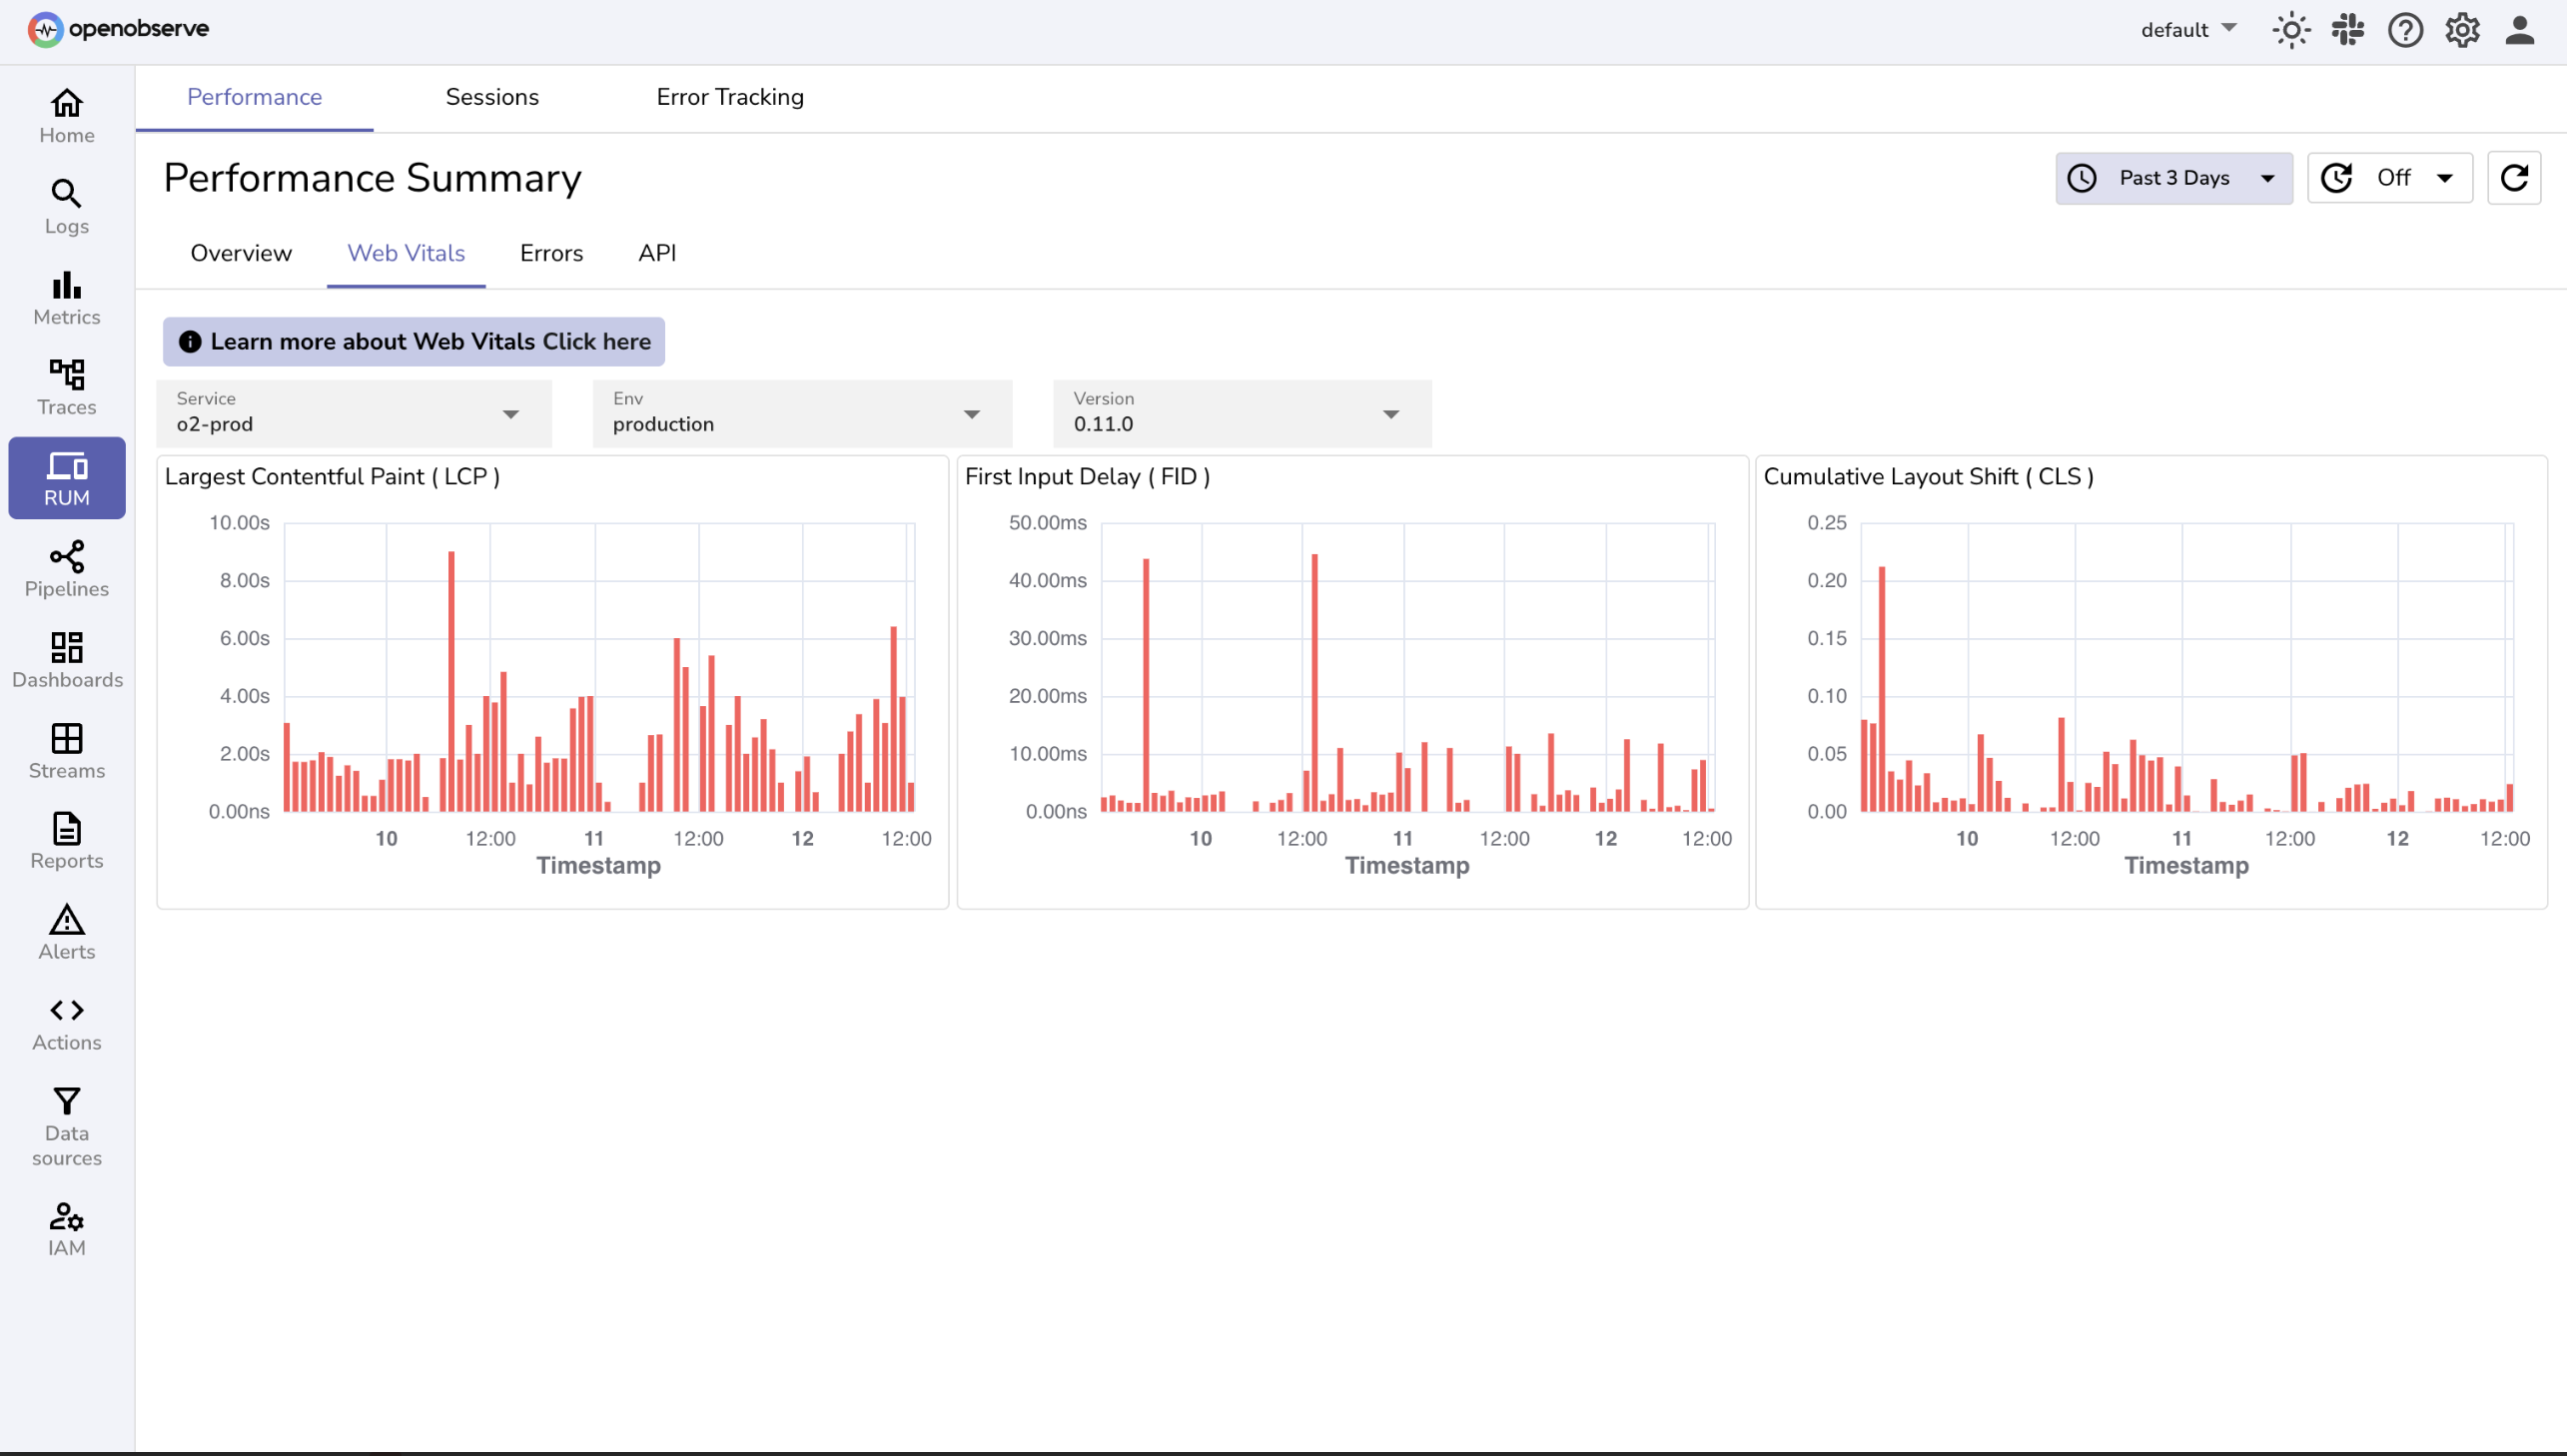
The frontend observability tooling covers all of the signals you would expect: Core Web Vitals, page-load metrics, JavaScript error tracking with full stack traces and session context, geographic and device breakdowns, and session replay.
This is kind of par for the course these days, but the OpenObserve RUM implementation also benefits from the product’s "unified correlation" principle. The browser SDK propagates a W3C trace-context header on outbound fetch calls, meaning a single distributed trace can run from a user's click in the browser through every backend service it touches, landing in the same trace store as your server-side OpenTelemetry instrumentation.
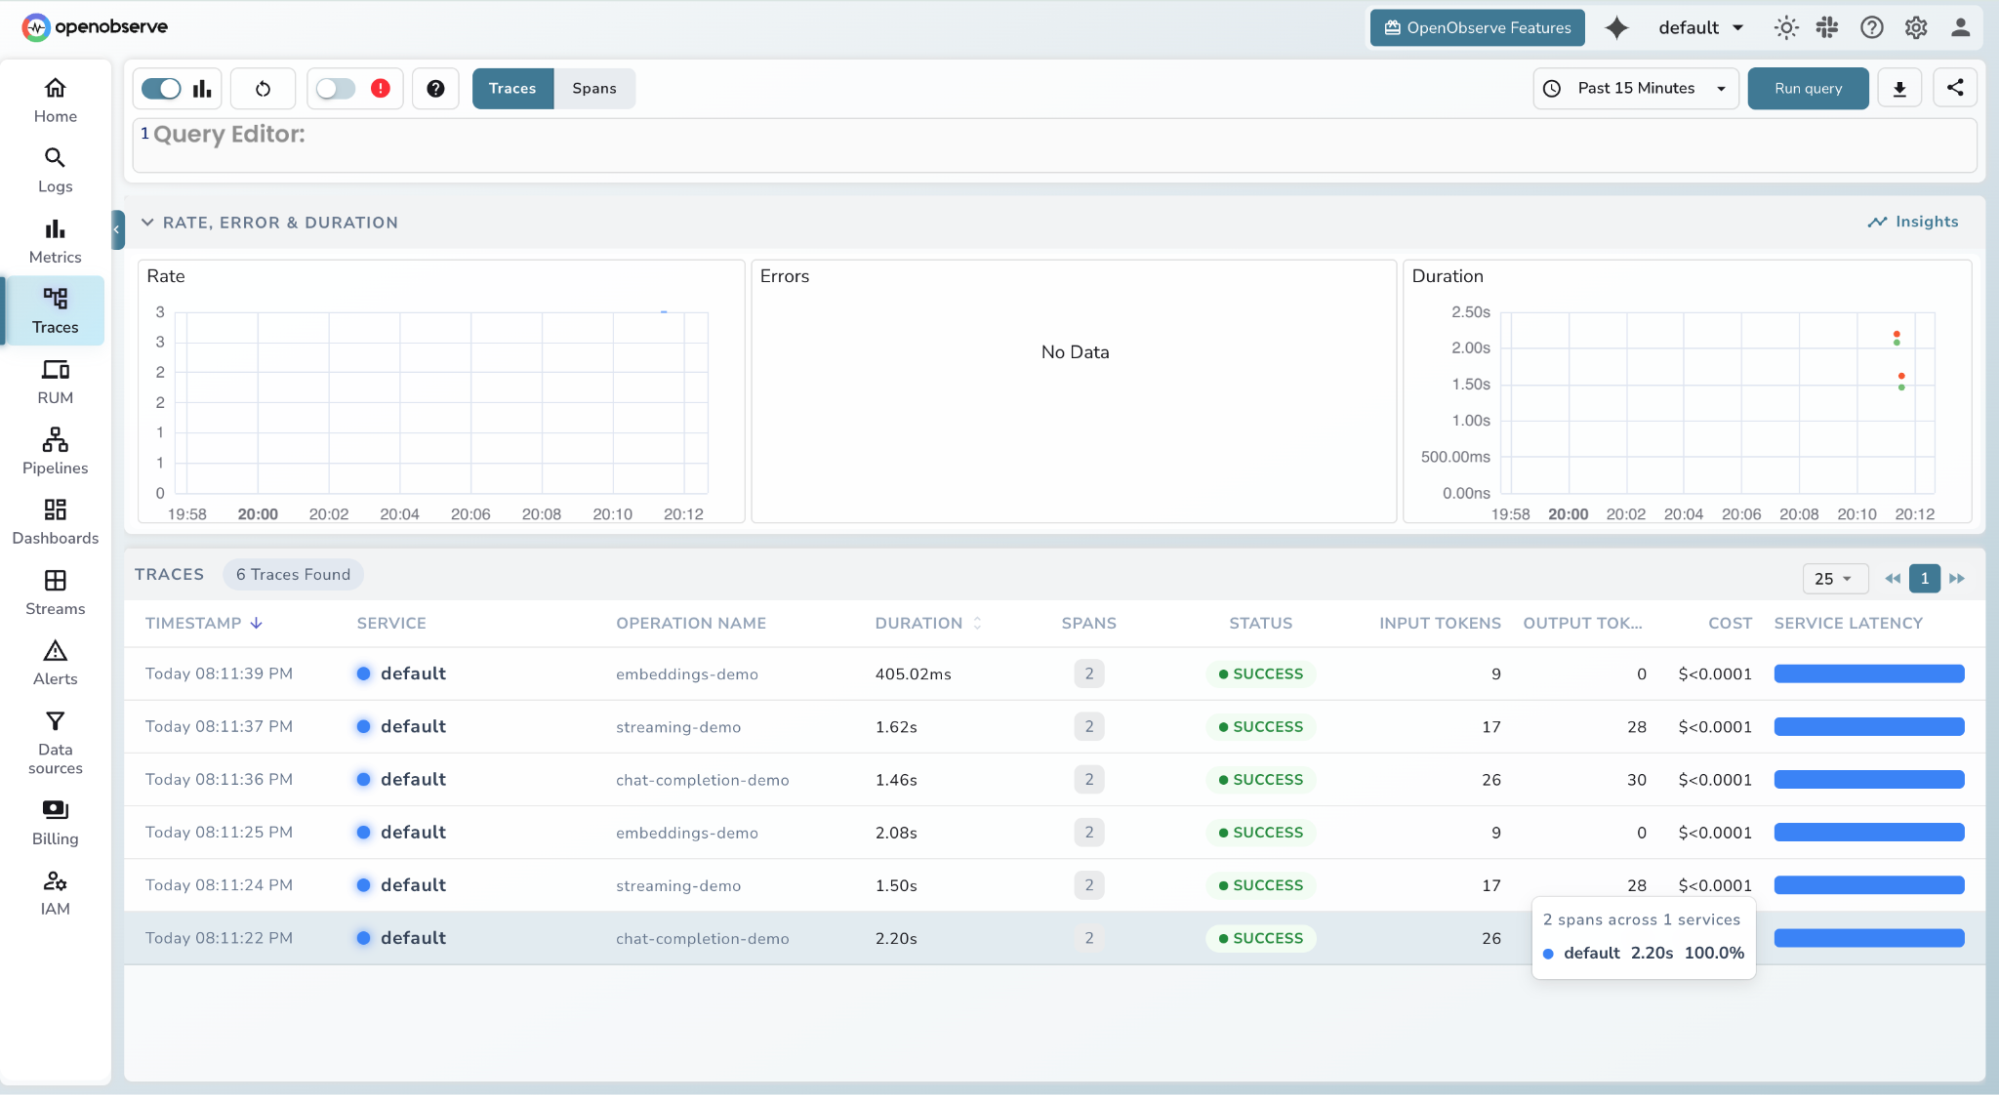
The AI Assistant is a chat interface embedded in the OpenObserve UI that turns natural-language questions into SQL, PromQL or VRL. However, you can also do lot’s more, such as creating dashboards and alerts from a conversational request and validating a query before it runs. The SRE Agent is a separate background service that also powers automated incident detection and grouping, AI-generated root-cause analysis, and a lifecycle model for incidents that re-runs its analysis as new evidence.
This is a bring-your-own-model setup: Anthropic, OpenAI or Google Gemini are all supported and there is an optional gateway layer for rate limiting and response caching in production. This is an Enterprise-tier feature and needs an API key of your own. The MCP server is something of a powerhouse, exposing well over 100 tools, including alert management, dashboard and folder operations, saved views, stream schema inspection, PromQL and SQL search, trace and LLM-session retrieval and user and role administration.
Synthetic Monitoring is one of OpenObserve's newest additions, currently in beta and available on OpenObserve Cloud only. It covers the protocol-level checks you'd expect (HTTP, TCP, TLS, SSH, each with its own assertions) alongside full browser-based checks built on Playwright. You can either record a user journey by clicking through it in a browser extension, or bring an existing Playwright script your engineering team already maintains in CI. Results land in a queryable synthetics_results stream like everything else, so alerting on them uses the same SQL-based alert mechanism as logs or metrics, rather than a separate, bolted-on system.
OpenObserve is a rich and mature platform and the above discussion can only give an overview of its capabilities. There is a lot more to discover. The foundation of the system is its Parquet storage model and on top of that foundation sits a genuinely broad feature set - real user monitoring with session replay, an AI assistant and background SRE agent an MCP server exposing well over 100 tools, synthetic monitoring and much more.
Naturally, every system has trade-offs and limitations, so what are some of the issues you might want to consider before you commit time to evaluating the system? The first is the licence: AGPL-3.0, one of the stricter copyleft licences in common use. In plain terms, that means if you take OpenObserve's code, modify it, and then make your modified version available to others over a network — for instance, by reselling it as your own hosted service — you're obliged to publish your changes under the same licence. Obviously, simply running OpenObserve internally, unmodified or with private tweaks you never expose to outside users, doesn't trigger that obligation.
The second is simply its relative youth: the AI layer — the Assistant and the SRE Agent - is largely a 2026 addition and therefore has not yet several years of production incidents to iterate over and really fine-tune its abilities. Whatever you decide, the OpenObserve experience is just a single binary away.
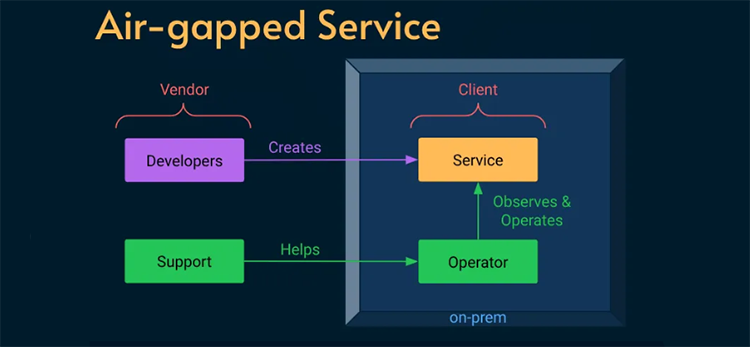
The excellent Alex Ewerlöf blog is now back in full swing and in this latest article he turns his attention to dealing with a real SRE curveball - how to build reliability engineering for an air-gapped system. We are talking hermetically sealed - not even a maintenance window for external connectivity. This task involved a high-security military facility where installing updates meant physically handing over an archive file to a system operator.
The constraints were pretty stringent - no logs, no metrics, no traces, no remote access of any kind.This was an extreme case and, ultimately, the solutions had to be both human-centred as well as relatively low-tech. How would you address the challenge? Hit the link below to read about the solution that Alex put in place.

In the past month or so the GitHub platform suffered a number of well-documented outages which resulted in loss of service for users. In the spirit of transparency, GitHub CTO Vlad Fedorov published this article on the GitHub blog, explaining the causes of the outages and the lessons learned as well as detailing the remediations that GitHub engineers will be putting in place.
The article really brings home the challenges of orchestrating the components of a global technology infrastructure - as well as the compounding effects of working at very large scale. The investigation revealed a perfect storm of edge cases, hidden tipping points and unforeseen knock-on effects. It’s impossible not to feel for the engineers sweating in the war-rooms as the dramas unfolded - after all, watching your failover fail must be pretty gut-wrenching.
If the Observability world had a code of secrecy akin to that of the Magic Circle, then Charity Majors might be in danger of being banished to exile and ignominy. In a single slide deck, she has blown the gaff on a whole trove of insider knowledge. It is the “What they don’t teach you at Harvard Business School” of observability knowledge. Not the abstract theory or technical detail but lessons and insights from the o11y frontline.
The deck in question was used in a talk at the LeadDev event in Berlin earlier this month and its 52 slides are an illuminating distillation of observability wisdom. We actually weren’t present at the talk and only came across the deck thanks to a mention in Michael Hausenblas’s excellent olly news newsletter. However, the slides contain sufficient clues (and images of unicorns) to easily re-construct the narrative and win friends and influence people as an observability savant.

If you are an SRE, when an outage happens you will know about it pretty quick. With security breaches the picture is rather less clear as, by their nature, they are designed to go undetected. Intrusion detection therefore is often based on a mixture of tools designed to spot unusual spikes, suspicious patterns or failed logon attempts.
This article by Fatih Koç argues that one of the major difficulties involved in identifying attacks is that of correlating signals across multiple sources such as Falco, Prometheus, Kubernetes Audit Logs etc. In this article, he outlines a strategy for extracting relevant data from each of these sources and pulling it together into a single observability dashboard.

The first line of cyber defence is normally at the perimeter - preventing attackers from entering your network in the first place. The next line of defence is intrusion detection. This can often take the form of anomaly detection using a variety of heuristics.
There are also some more creative possibilities, such as the canary solution adopted by Grafana. Just as the canary in the coalmine sings to alert underground workers to the presence of toxic gases, Grafana’s canary was designed to alert them to the possible presence of intruders in their domain.

Load testing can be simple in theory but in modern distributed architectures, it involves a lot more than throwing requests at an individual service. This article on the Airbnb engineering blog looks at how the company’s engineers use the Impulse load-testing framework to handle a number of more complex requirements such as dependency mockingand managing messaging and asyncronous calls.
Unfortunately, at the moment Impulse is just an internal Airbnb framework, so you won’t be able to get your hands on it at present. At the same time, the article provides a valuable blueprint for tackling advanced, real world load testing scenarios.
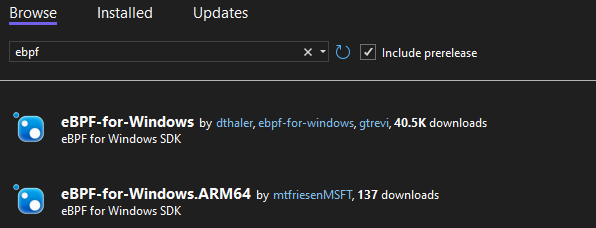
It's an announcement that might have seemed unthinkable not long ago, but the porting of the revolutionary eBPF technology to Windows is now a reality. The ability to bring safe programmability to the kernel has resulted in enormous gains in fields such as security, networking and observability for Linux hosts, so applying the same principle to the Windows ecosystem is obviously an attractive proposition. It is not, though, without its own difficulties. There were a lot of hurdles to overcome and, inevitably, given the differences in OS architecture, this is not a full-fidelity replica of the Linux implementation.
This possibly foundational article by Pavel Yosifovich guides you through the steps involved in boldly going where few have gone before and creating your first eBPF program for Windows. One paragraph in the article begins with the sentence “this is where things get a bit hairy“ - for some that will likely be a challenge rather than a deterrent. This may not be cooking up nuclear fusion in your bedroom, but it does feel pretty radical.
As well as rolling out their Open AI observability solution, Elastic have also been very active within the OpenTelemetry project. C++ has a reputation for being something of a fearsome foe for observability practitioners. In this article on the Elastic blog, Haidar Braimaanie dons his protective gear and attempts to tame the beast with a soothing dose of OpenTelemetry instrumentation.
Unlike languages built in frameworks such as .NET, C++ does not have a standardized runtime environment that supports dynamic instrumentation across all platforms and compilers. C++ also uses a variety of build systems such as Makefiles and CMake, so that implementing instrumentation can be difficult and error-prone. In the article, Haidar looks at adding OpenTelemetry support to a C++ application running on Ubuntu 22.04. He also includes sample code for instrumenting the project with database spans and then observing the application in APM.
After reading this article you may want to give the C++ developer in your life a hug.
Even if you are not familiar with the name of Brendan Gregg, you are almost certainly familiar with the fruits of his labours. Brendan is the creator of the Flame Graph - one of the most important and iconic visualisations in the observability toolkit.
We featured the Flame Graph in our recent tribute to the work of UX designers in the observability arena - but you should also visit Brendans’ web site.
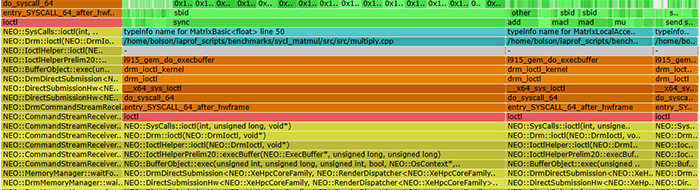
Brendan's latest innovation is the AI Flame Chart. This is an evolution of the original flame graph and its ambitious aim is to help reduce the vast financial and environmental costs entailed in the use of LLM’s. This means that whereas the original flame graph was focused on CPU cycles, the latest generation sets its sights on reducing GPU load. The article discusses the considerable complexities involved in mapping GPU programs back to their corresponding CPU stacks.
The names of some of the instruction sets look intimidating to the uninitiated but the basic concept of the graph is quite simple - the wider the bar, the more resource it consumes.
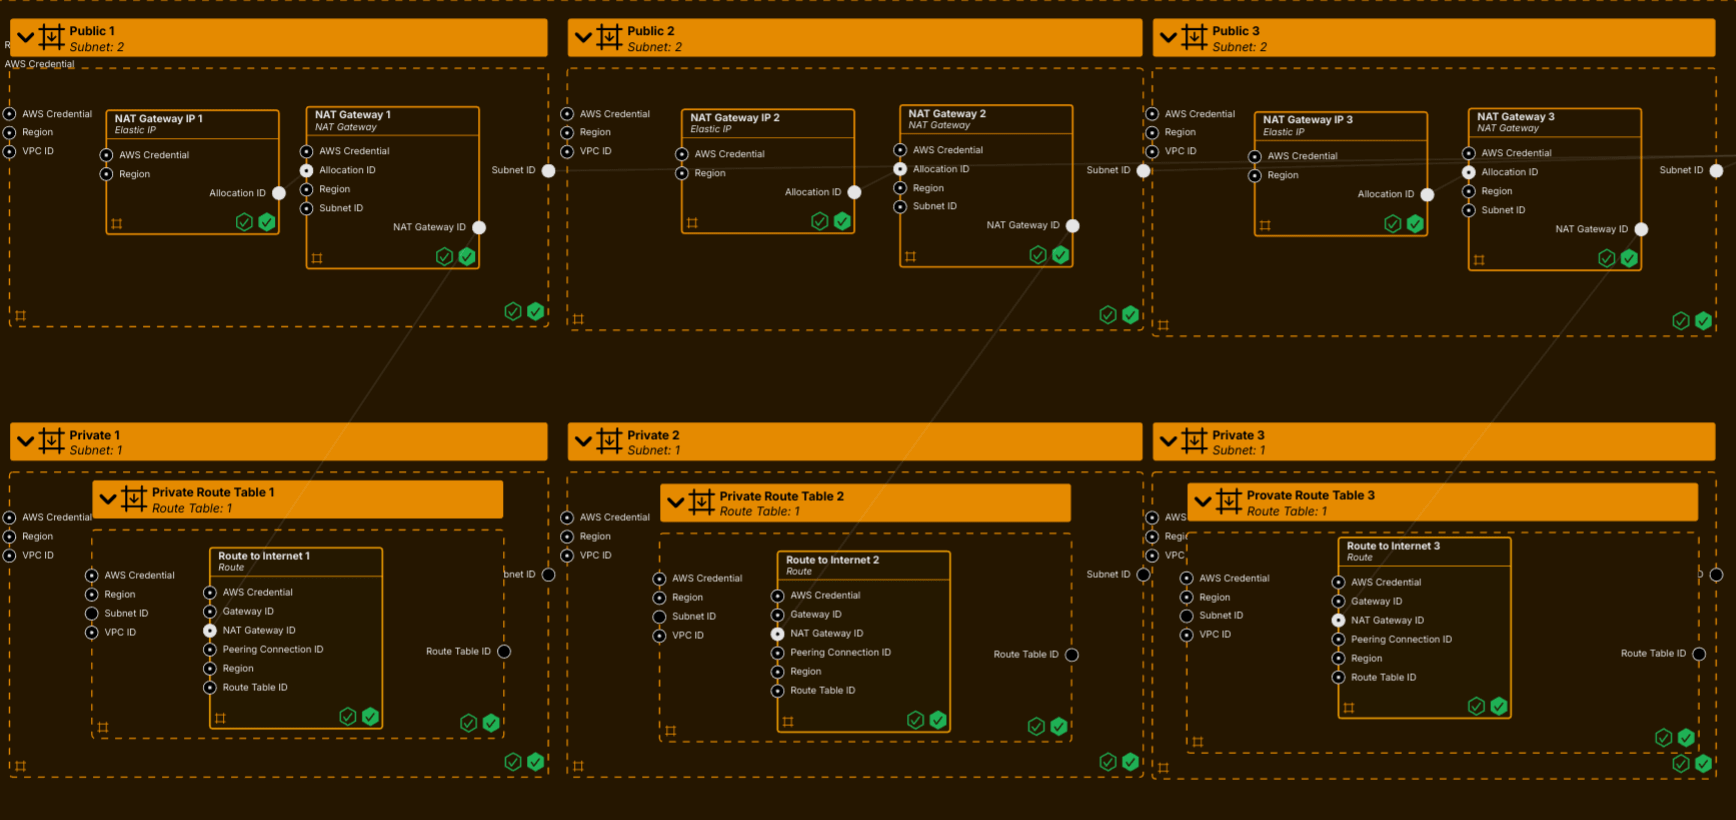
If you have ever had to grapple with a 3,000 line Helm chart to deploy your observability infrastructure, you may be forgiven for thinking that there must be a better way to do this. Whilst YAML has a certain formal elegance, its syntax struggles to express the architectures and relationships embedded in highly complex systems.
Whilst Pulumi have tackled this problem by enabling the use of high level programming languages for IaC, System Initiative are taking a fundamentally more radical approach. Their goal is nothing other than completely reinventing IaC from the ground up. The blog article for the launch of the product is an incredibly ambitious statement of intent. The terms ‘game changer’ and ‘paradigm shift’ tend to be thrown around somewhat casually, this might be a case where their usage is appropriate.
So, what are they proposing? Well, System Initiative is IaC without the code. It is a kind of digital canvas where you manipulate digital twins of your systems. Is the future here or is this the Platform Engineering equivalent of science fiction? Read the article and decide for yourself!