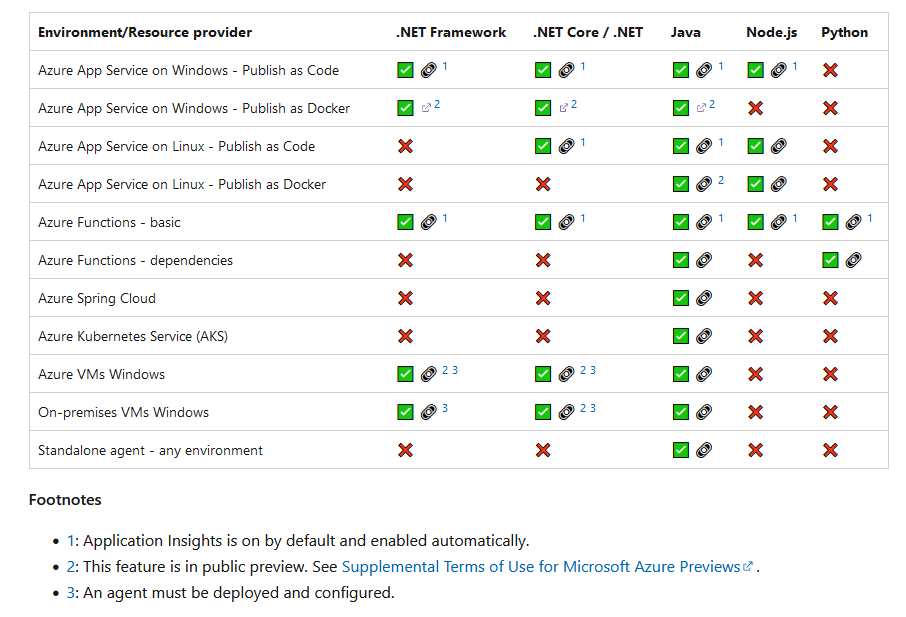
AutoInstrumentation
Application Insights can, essentially, either be run in a loosely coupled mode which requires almost zero configuration or in more tightly coupled modes which may require installation of packages at the solution level as well as creating explicit dependencies at the source code level. If you are following the 12 Factor App philosophy, then the former approach may be preferable. AutoInstrumentation is applied at the platform level and is transparent to the application itself. The Application Insights agent will automatically be installed for the Web App and run alongside it in Azure, but you don't need to make any code changes or install any packages or Connected Services in Visual Studio. At this time, AutoInstrumentation is not supported for apps running on AKS. The table below shows the support for AutoInstrumentation across different application types and platforms as of July 2023:
Click on image to enlarge
Source: https://learn.microsoft.com/en-gb/azure/azure-monitor/app/codeless-overview
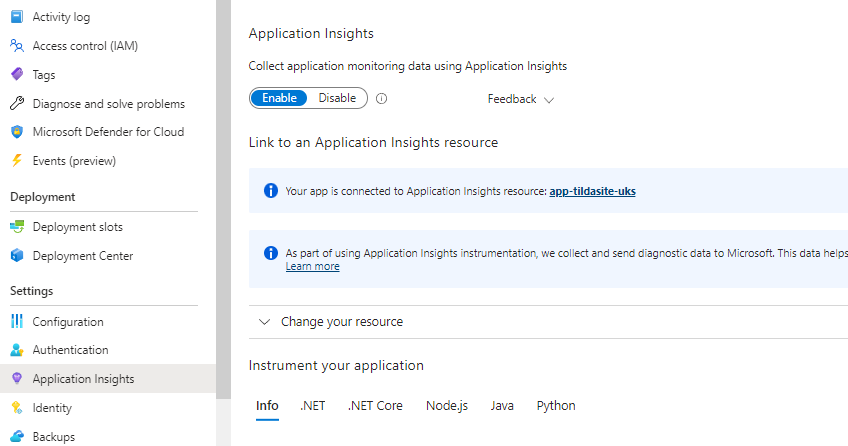
According to the table, a Web App running on a Linux host and published as code has App Insights "on by default and enabled automatically". Even though the instrumentation is auto-enabled for this scenario, you still need to enable Monitoring in the Azure portal (or in code) to view your telemetry in Application Insights.
Profiling
The Microsoft documentation describes the Profiler as follows:
https://learn.microsoft.com/en-us/azure/azure-monitor/profiler/profiler-overview
Diagnosing performance issues can be difficult, especially when your application is running on a production environment in the cloud. The cloud is dynamic. Machines come and go, and user input and other conditions are constantly changing. There's also potential for high scale. Slow responses in your application could be caused by infrastructure, framework, or application code handling the request in the pipeline.
With Application Insights Profiler, you can capture and view performance traces for your application in all these dynamic situations. The process occurs automatically at scale and doesn't negatively affect your users. Profiler captures the following information so that you can easily identify performance issues while your app is running in Azure:
- Identifies the median, fastest, and slowest response times for each web request made by your customers.
- Helps you identify the "hot" code path spending the most time handling a particular web request.
Enable the Profiler on all your Azure applications to catch issues early and prevent your customers from being widely affected. When you enable Profiler, it gathers data with these triggers:
- Sampling trigger: Starts Profiler randomly about once an hour for two minutes.
- CPU trigger: Starts Profiler when the CPU usage percentage is over 80 percent.
- Memory trigger: Starts Profiler when memory usage is above 80 percent.
Each of these triggers can be configured, enabled, or disabled on the Configure Profiler page.
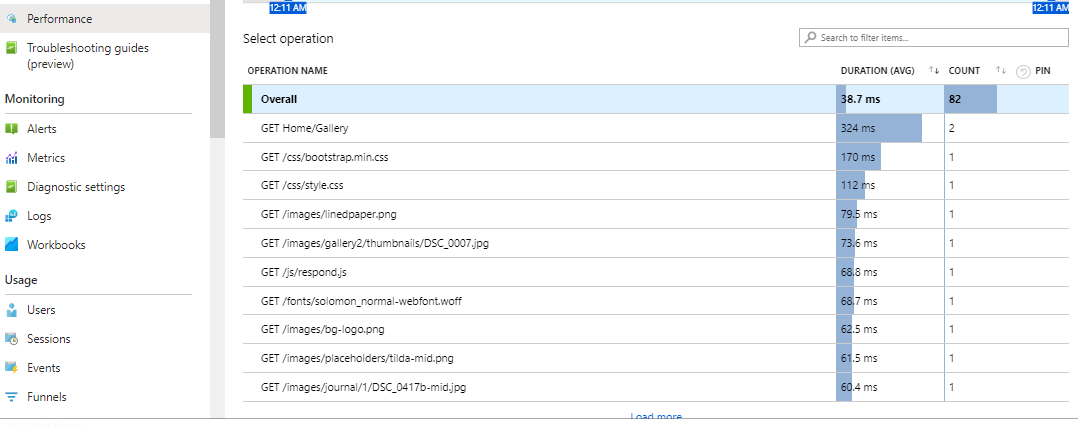
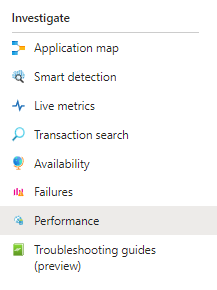
To access the Profiler just click on the Performance option in side menu:
Click on image to enlarge
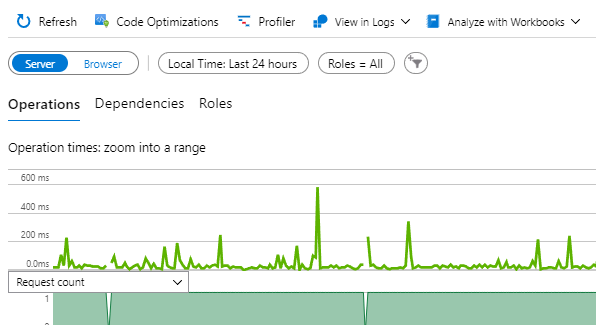
Within the Performance view, you will also see a Profiler option:
Click on image to enlarge
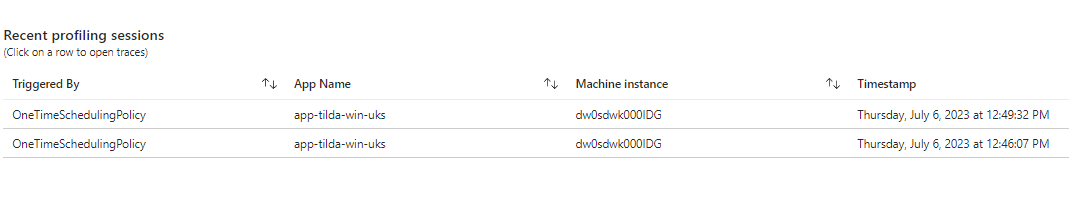
If you click on this option you can see that some profiling sessions have automatically been created:
Click on image to enlarge
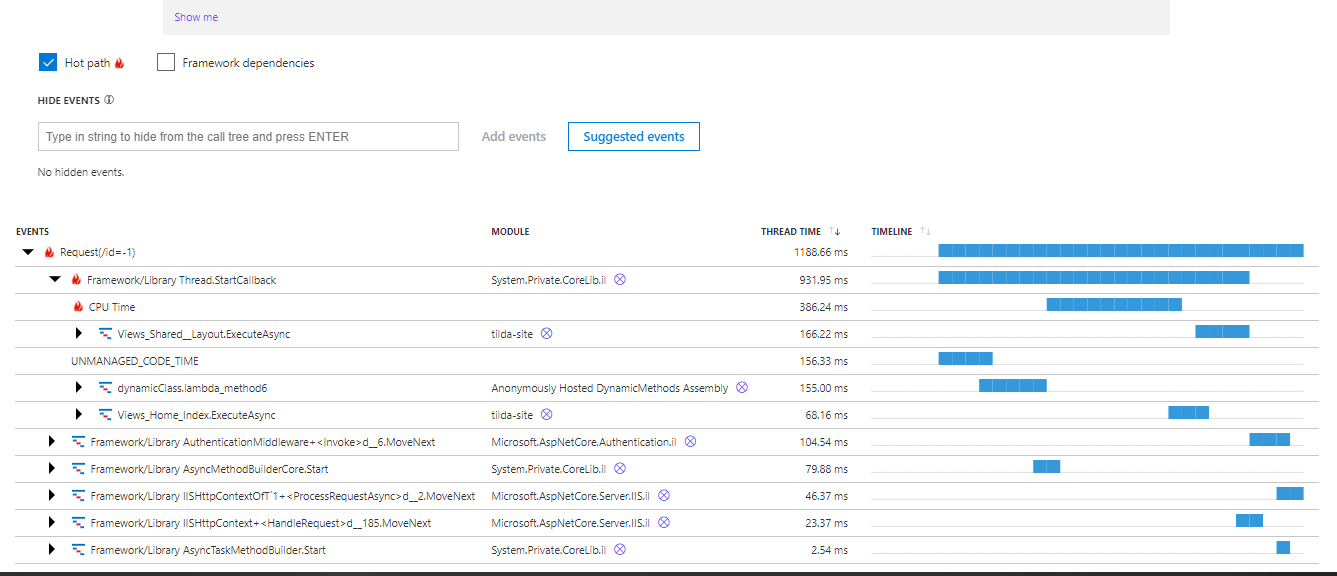
This gives us some really rich metrics on CPU usage at a really granular level:
Click on image to enlarge
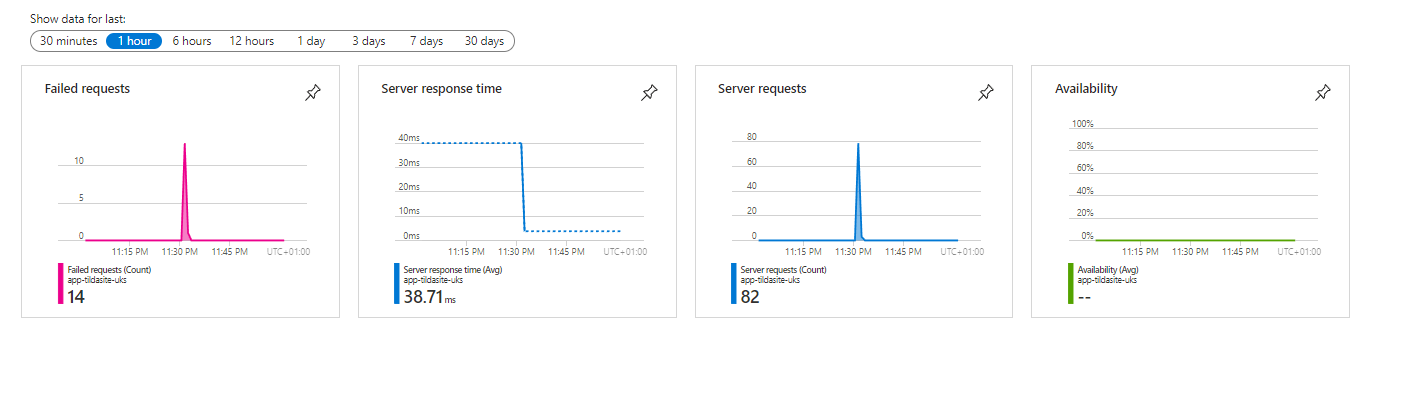
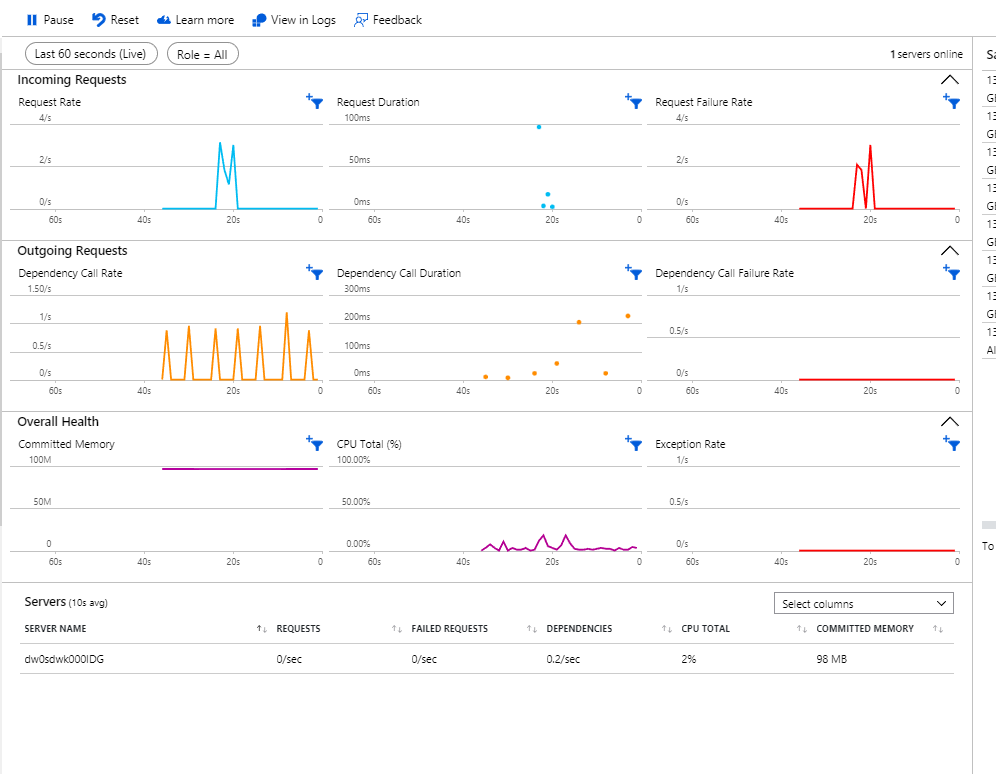
Live Metrics
This is a really powerful feature - and as the name suggests, gives us a real-time view of some key metrics for our application. This can be especially valuable if you have just deployed an update to your application and want some visual confirmation that it appears to be running correctly.
This is a feature which really lives up to its name as there is a latency of around one second for displaying your application metrics. The metrics are streamed and then discarded - so using Live Metrics does not incur any storage charge - equally there is also no charge for streaming the metrics. If you need to, you can also use the SDK to to fine-tune or extend the Live Metrics confiuration.
Click on image to enlarge
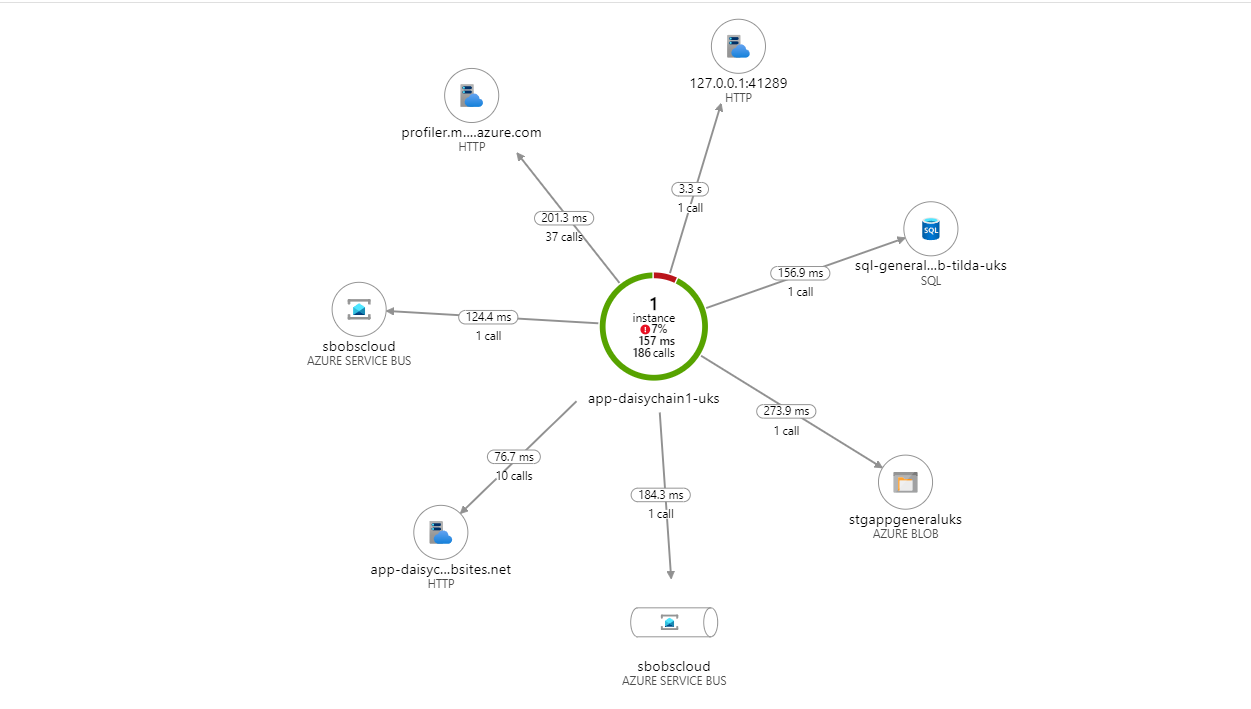
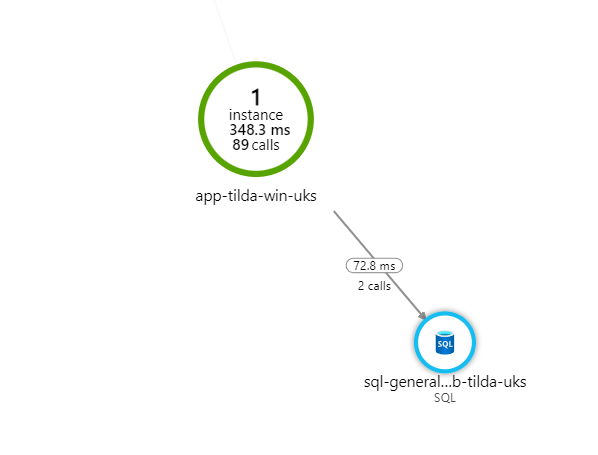
SQL Commands
Our application makes back-end calls to a SQL Server database hosted in Azure. We have already seen from the Application Map that Application Insights has identified that we are connecting to a SQL database:
Click on image to enlarge
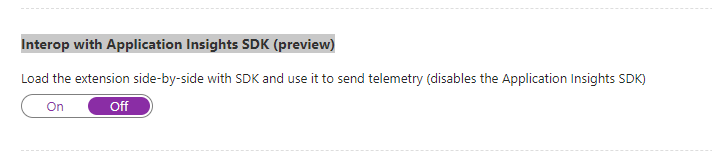
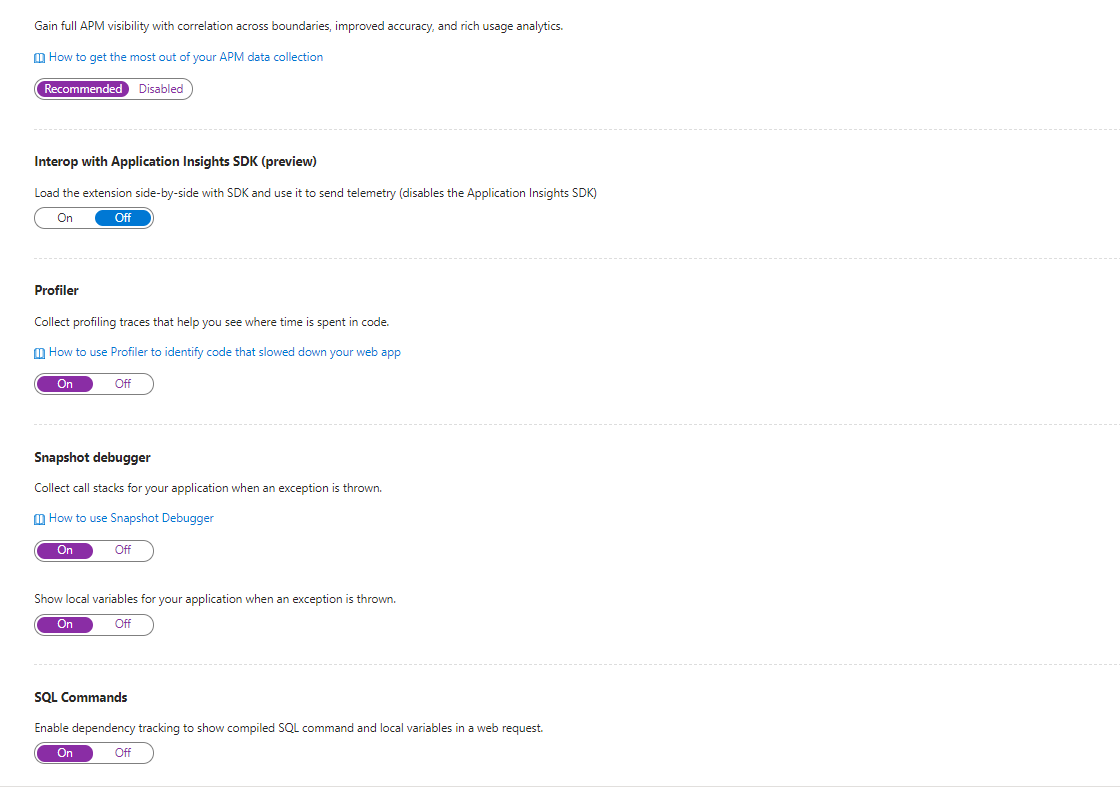
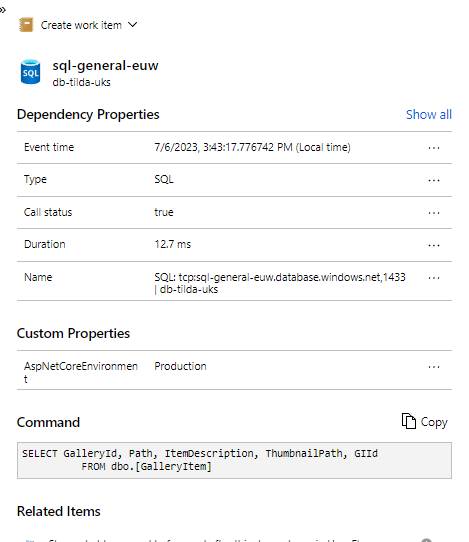
If we have the SQL Commands option enabled we can drill down and see the actual query being sent to the Sql server.
To be able to achieve this level of end to end visibility with very light touch configuration and no up-front cost is quite a persuasive selling point for Application Insights.
Naturally, Microsoft have an inherent advantage here as Azure is their platform so they can enjoy the benefit of directly accessing the internal plumbing whilst third parties will have to build agents dependent on API's.
Click on image to enlarge
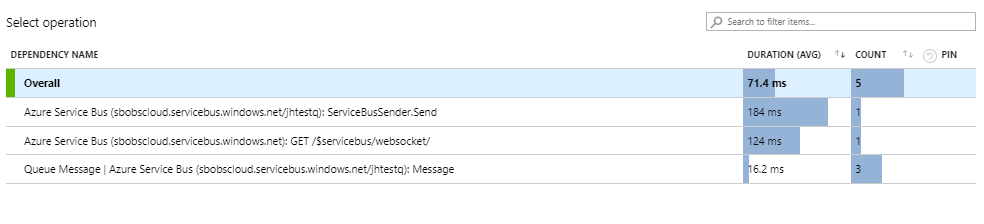
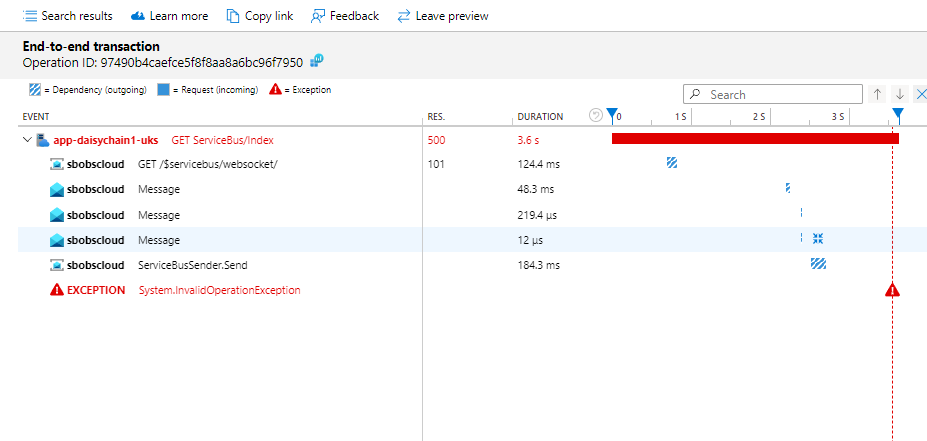
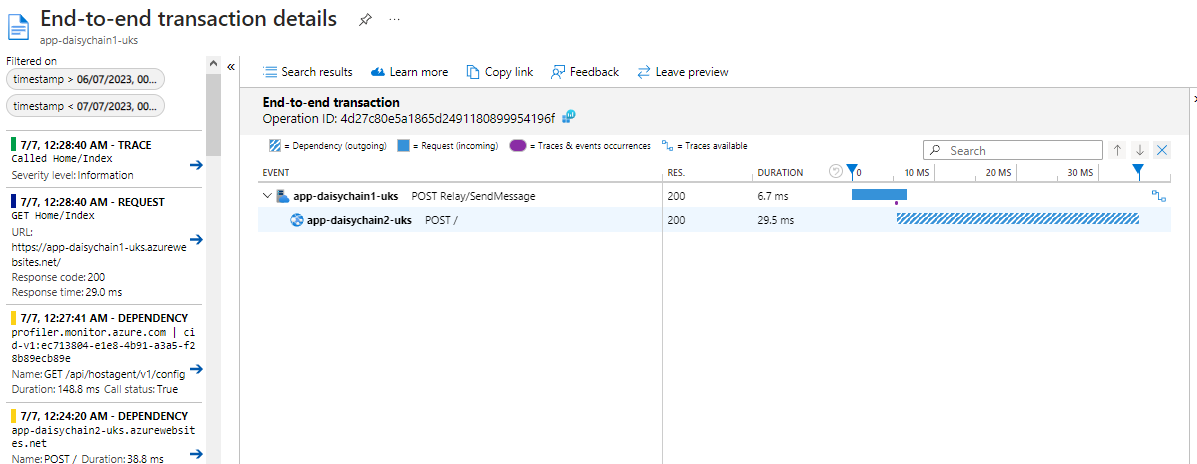
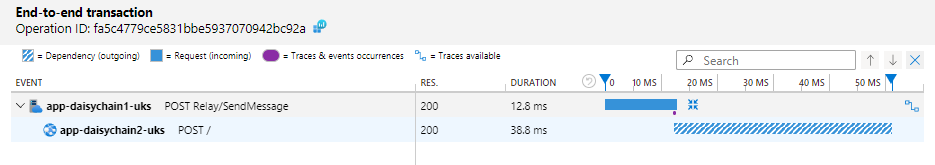
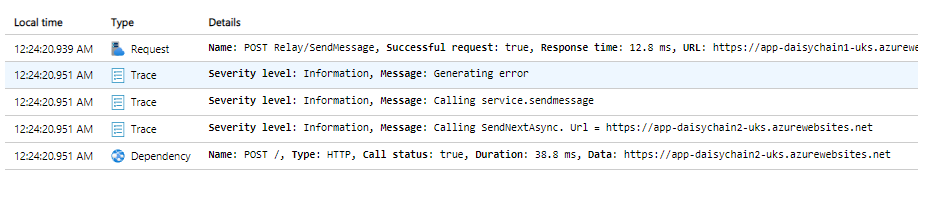
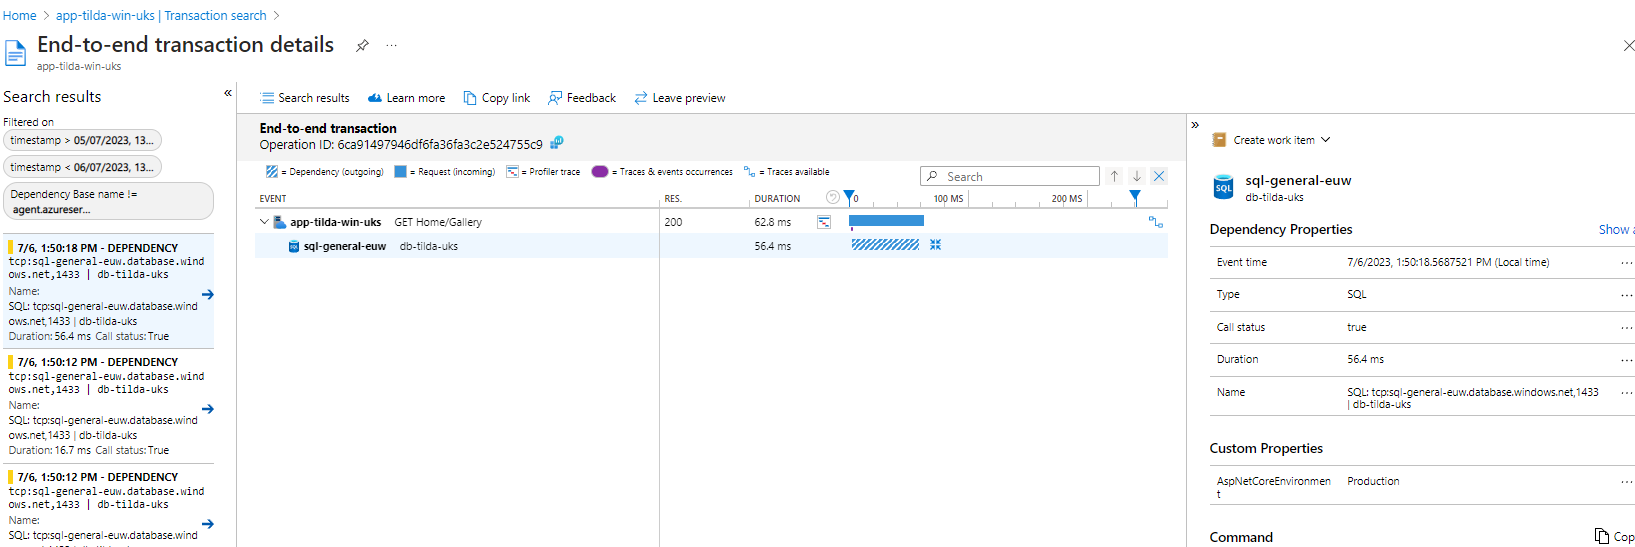
We can also drill down and see transaction details:
Click on image to enlarge
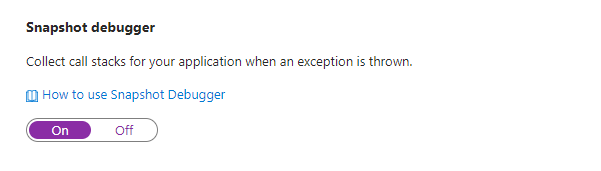
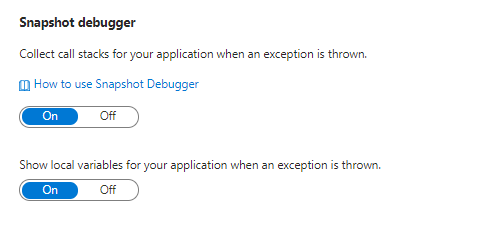
Snapshot Debugger
The thought of having a 'debugger'' running on a production system is enough to bring most sys admins out in a cold sweat. Luckily, the snapshot debugger is not a tool that enables devs to remotely step through their code as it is running on a live system. Instead, it collects a snapshot to give a fuller picture of your application state when an exception is thrown.
Enabling the debugger is simple:
Click on image to enlarge
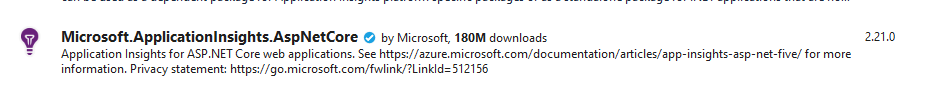
Next we need to install the Application Insights SDK Nuget package
Click on image to enlarge
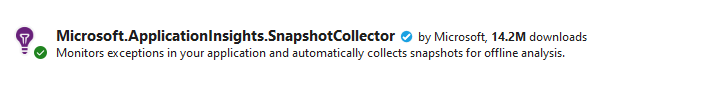
Then install the Application Insights Snapshot Collector Nuget package:
Click on image to enlarge
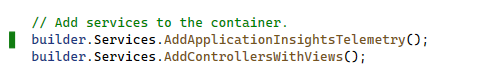
Then we need to enable Telemetry in our startup configuration in Program.cs:
Insert the following code prior to the builder.Services.AddControllersWithViews() statement. This code automatically reads the Application Insights connection string value from our configuration.
The AddApplicationInsightsTelemetry method registers the ApplicationInsightsLoggerProvider with the built-in dependency injection container that will then be used to fulfill ILogger implementation requests.
builder.Services.AddApplicationInsightsTelemetry();
so that your code looks like this:
Click on image to enlarge
You also need to add this line to enable the Snapshot Collector
builder.Services.AddSnapshotCollector(config => builder.Configuration.Bind(nameof(SnapshotCollectorConfiguration), config));
In your application code add dependency injection in your classes to obtain an instance of the TelemetryClient:
    private TelemetryClient _telemetryClient;

    public ImageService(TelemetryClient telemetryClient)
    {
        _telemetryClient = telemetryClient;
    }
Then add a call to the TrackException method in your error handler. In the code below we are calling the Application Insights TrackException method.
One of the benefits of this method is that it allows us to pass in dictionary objects which might contain any additional information that might be useful to us analysing our error.
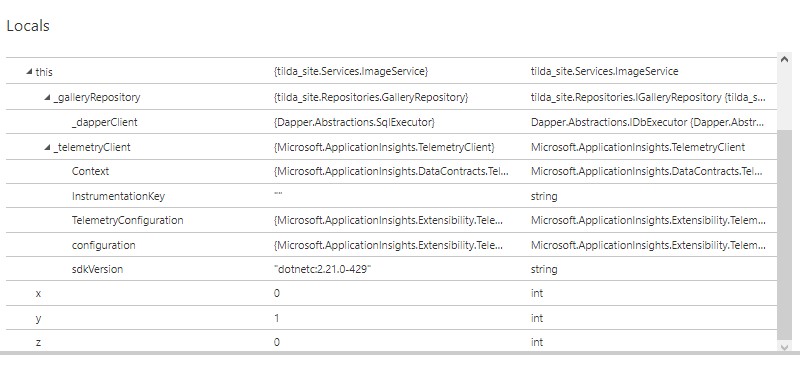
The real beauty of the Snapshot Debugger is that it will also capture the value of local variables in our method. We have created two dummy variables - x and y - and populated them with values.
Our aim is that we should see these values being picked up in our snapshot. We are also deliberately generating a divide-by-zero error which we hope to be able to track later on.
    int x = 0;
    int y = 1;
    try
    {
        int z = x / y;
    }
    catch ( Exception ex ) {
        var properties = new Dictionary<string, string>
        {
            ["Application"] = "App1"
        };

        var measurements = new Dictionary<string, double>
        {
            ["Level"] = 1
        };

        telemetry.TrackException(ex, properties, measurements);
    }
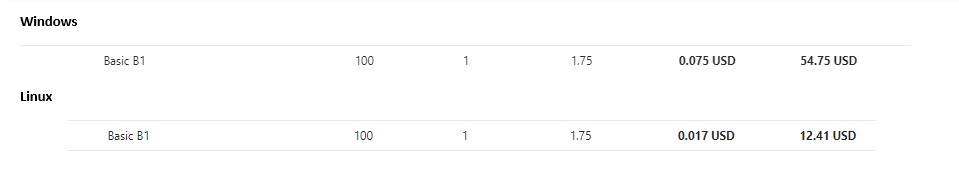
Unfortunately, at the moment the Debugger is only supported on Applications running on a Windows host. Developers have made requests for the functionality to be extended to Linux hosts but the official response on this ticket suggests that Linux support will not be added any time soon.
From a technological point of view this should not be a deal-breaker if you are developing platform independent Web Apps. From a cost point of view though, running on a Windows Service Plan can be significantly more expensive than the Linux equivalent, this differential is especially pronounced at the Basic Tier. Snapshot Debugging is a great feature but a lot of customers may baulk at the prospect of shelling out $55 per month for a Windows plan vs $12 per month for a Linux one.
Click on image to enlarge
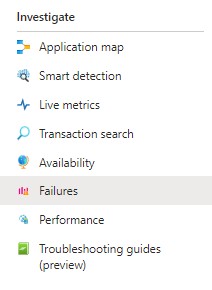
To view our snapshot we can start by clicking on the Failures option in the Investigate section of the sidebar:
Click on image to enlarge
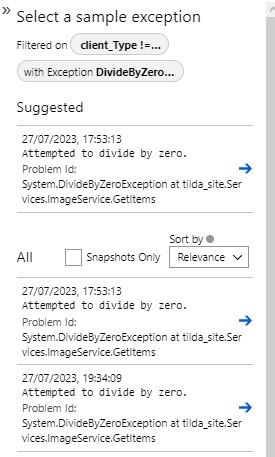
If we click on the right hand column we can select an exception to inspect:
Click on image to enlarge
We have added code to our method to generate a DivideByZero exception and we can see these errors listed here. If we click on one of the exceptions we see we have a link to open a Debug Snapshot.
When we open the snapshot we can see the call stack as well as a Locals pane, where we can see the values of all the local variables at the time the exception occurred. This is a fantastic aide for debugging and diagnostics.
Click on image to enlarge
Viewing Metrics in Log Analytics
We have seen that in our App Insights portal we could view the following metrics in the Live Metrics pane:
- Request Rate (per second)
- Request Duration
- Failure Rate
- Dependency Call Rate
- Dependency Call Duration
- Dependency Call Failure Rate
- Committed Memory
- CPU Total
- Exception Rate
You might think that, since our Log Analytics workspace captures logs from multiple Application Insights instances, we could use it as a portal for viewing these metrics across multiple applications simultaneously. Unfortunately, Log Analytics does not have a direct equivalent of the Application Insights Live Metrics view.
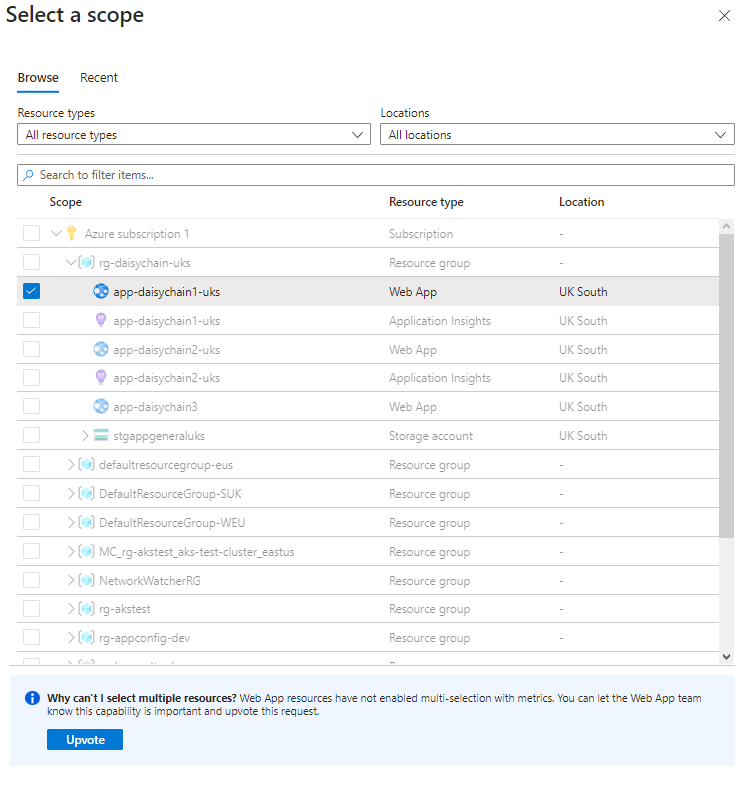
If we click on the Metrics option in the Monitoring section of the side menu we can only select metrics for a single source:
Click on image to enlarge
The 'Upvote' option in the above screen shot would seem to suggest that Microsoft are aware that users would like the option to multi-select on this screen.
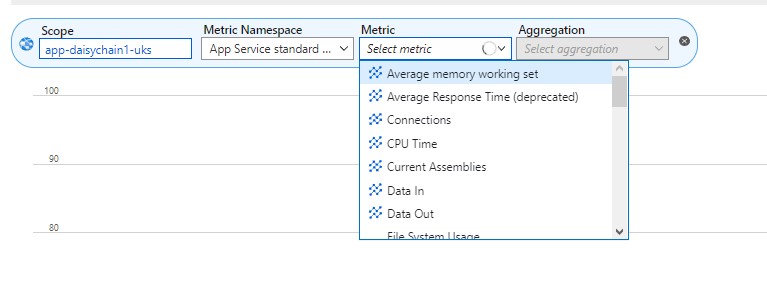
Once we select our App Service, the Metric Namespace is assigned as "App Service Standard Metrics" and the following metrics are made available from the drop down list.
Click on image to enlarge
The full set of metrics available for Web Apps and App Service Plans is listed in Appendix 2
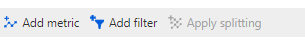
By using the 'Add metric' option
Click on image to enlarge
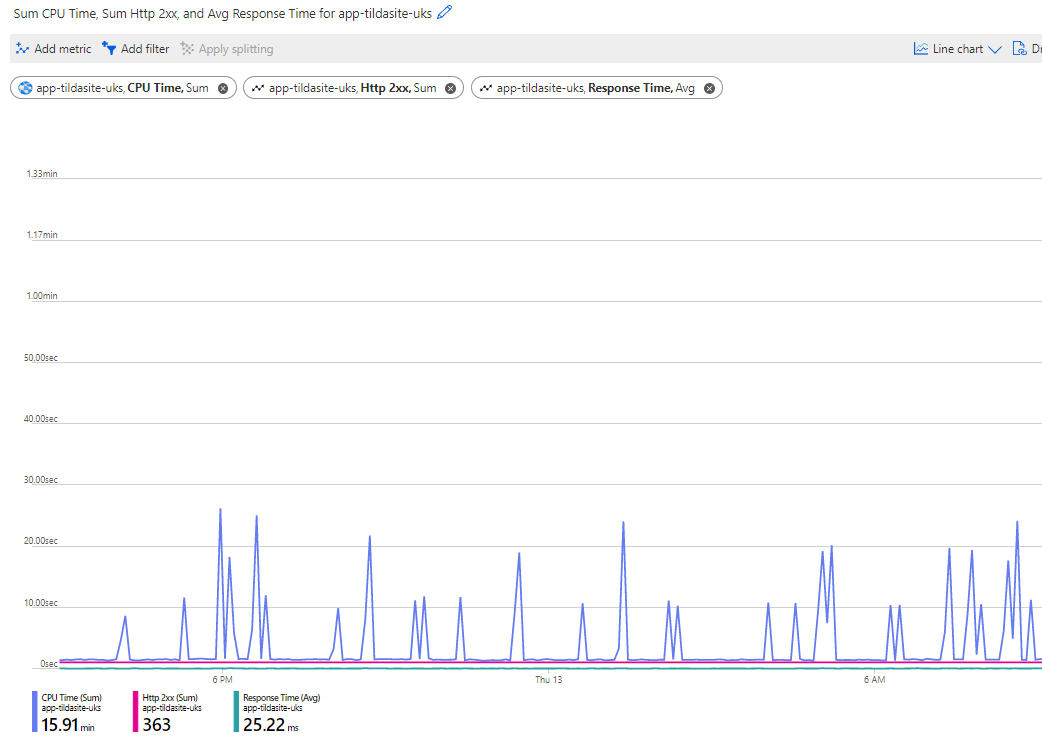
we can combine multiple metrics in the same chart
Click on image to enlarge
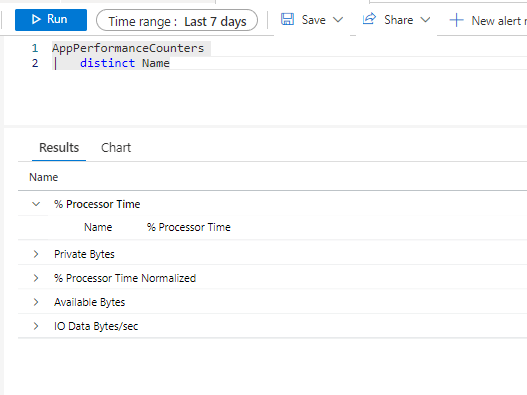
There are not really any useful charts or queries for viewing metrics for multiple applications simultaneously. We can run queries against the AppPerformanceCounters table but, out of the box, this only captures a small set of metrics:
- % Processor Time
- Private Bytes
- % Processor Time Normalised
- Available Bytes
- IO Data Bytes/Sec
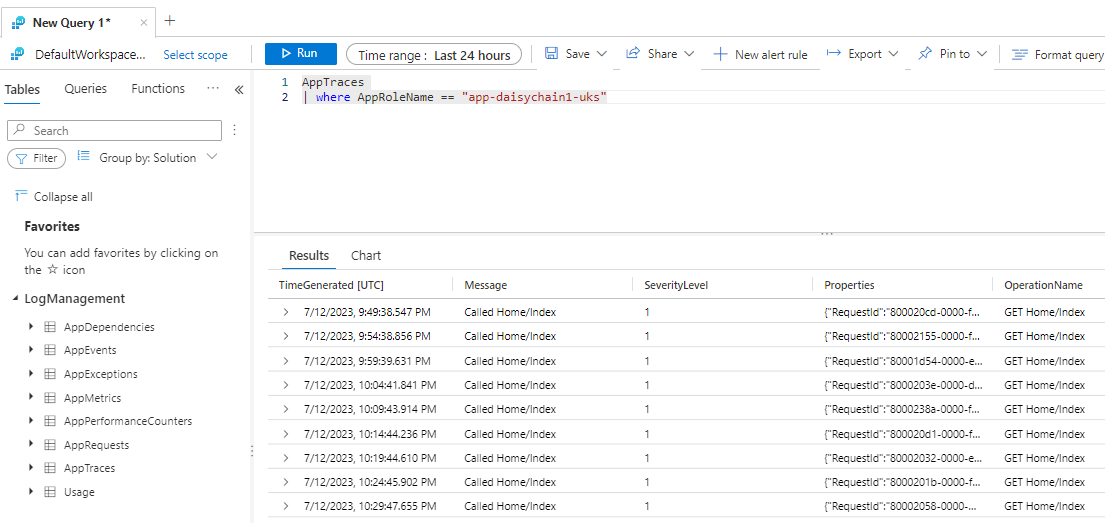
We can see this by running a simple query on the table itself:
Click on image to enlarge
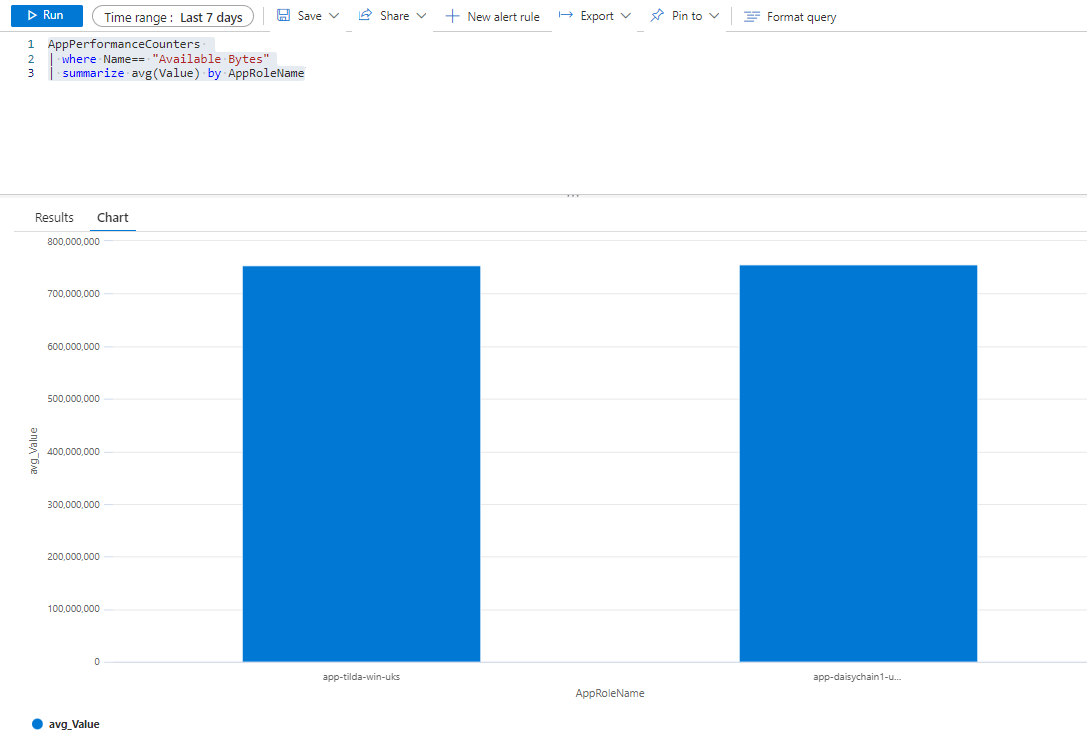
A query such as the following:
    AppPerformanceCounters
    | where Name== "Available Bytes"
    | summarize avg(Value) by AppRoleName
will render a chart spanning multiple applications:
Click on image to enlarge
However, this leaves us having to manually craft a number of queries and attach the resulting charts to custom Dashboards.
Adding further performance counters
It is possible to capture metrics for additional performance counters. The bad news is that you can only do this
"if your application is running under IIS on an on-premises host or is a virtual machine to which you have administrative access.""
Obviously, this does not have much mileage in a cloud environment (unless you are running web applications on Windows VM's)
What about System.Diagnostics.Metrics?
You may have come across the System.Diagnostics.Metrics namespace, which is part of the .Net specification. Could we somehow use this to surface additional resource and performance metrics? Unfortunately, this will not help you with retrieving physical resource metrics such as disk i/o, memory usage etc. Instead, this library provides constructs for creating, collecting and forwarding custom metrics to other observability tools. The documentation envisages that you would use the library for defining business related metrics - e.g. "number of widgets sold per minute". The classes in the library help to ensure that your counters and other constructs are compatible with metrics scraping tools such as Prometheus.
Application Insights SDK
In this investigation we have limited ourselves to using the Auto Instrumentation capabilities of Application Insights. The Application Insights SDK is a sophisticated library offering a wealth of programmable features. This is a topic in its own right and we will take a deep dive into it in a separate article
Data Retention
As we have noted earlier, Application Insights telemetry is sent to a Log Analytics workspace - and this means that you will incur storage costs. Over time, as you bring more services on stream and as logs accumulate these can put quite a dent in your budget. Apart from burning a hole in your pocket, storage costs can also be difficult to pin down.
You therefore need to be proactive and stay on top of data sources, ingestion volumes and retention periods. As your application and monitoring landscape becomes more populous and heterogeneous, this can present a formidable challenge.
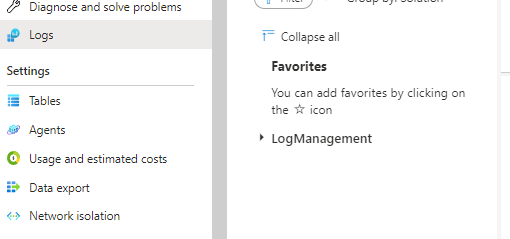
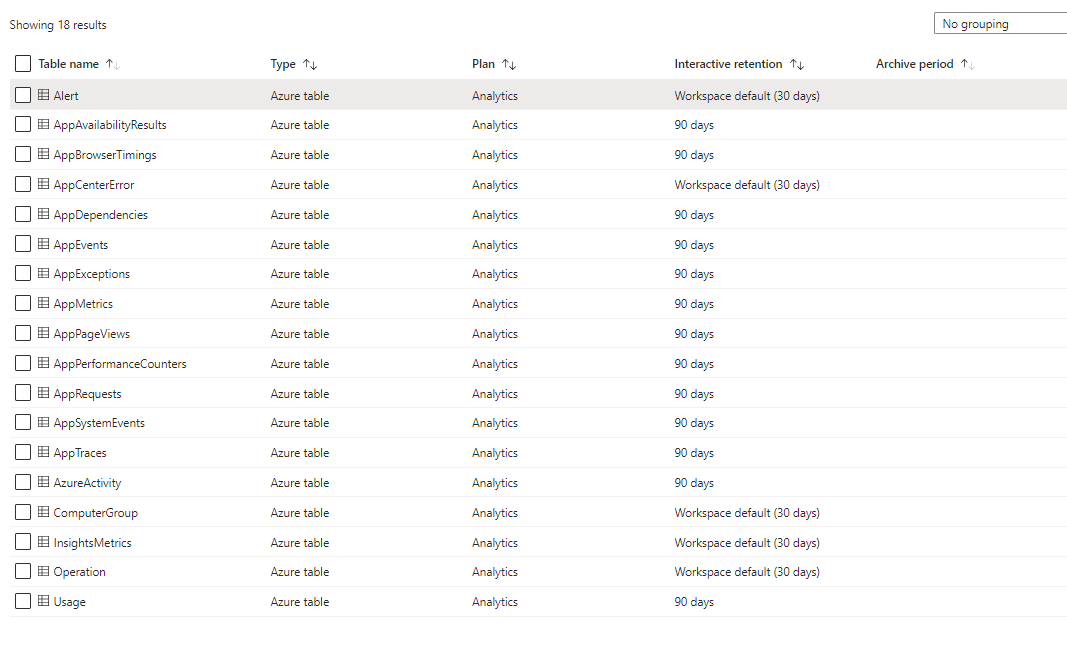
Fortunately, Log Analytics is pretty strong on cost and retention transparency. The Tables view (available from the Settings/Table menu option) provides a listing of workspace tables as well as their configured retention periods:
Click on image to enlarge
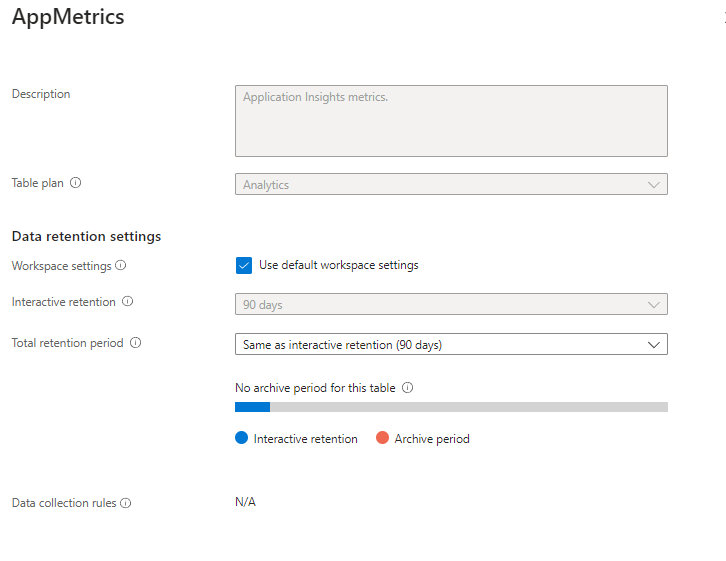
You can use the Manage Table option to adjust the retention settings:
Click on image to enlarge
You can see here that the default setting for interactive retention for the AppMetrics table is 90 days. Depending on your needs you can reduce this to thirty days or extend it up to two years. As metrics are ephemeral you might want to re-set this to 30 days to trim your storage costs. Unfortunately, this is the minimum - you have no choice but to store the data for at least 30 days. Depending on your regulatory needs you can set an archive period of up to seven years. Interactive retention means that you can retrieve the data by running interactive (Kusto) queries on the table.
Archival
Archival means that the data remains in the table - which may be necessary for regulatory purposes - but cannot be queried. If you need access to the data once it has been archived you have two options:
- run a Search job
- run a Restore Logs job
Search jobs are asynchronous queries that fetch records into a new search table within your workspace for further analytics. The search job uses parallel processing and can run for hours across large datasets.
The restore operation makes a specific time range of data in a table available in the hot cache for high-performance queries. You can also use the restore operation to run powerful queries within a specific time range on any Analytics table. The main use case for this would be when the standard Kusto queries you run on the source table can't complete within the 10 minute timeout period.
When you restore data, you specify the source table that contains the data you want to query and the name of the new destination table to be created.
The restore operation creates the restore table and allocates additional compute resources for querying the restored data using high-performance queries that support full KQL.
The destination table provides a view of the underlying source data, but doesn't affect it in any way. The table has no retention setting, and you must explicitly dismiss the restored data when you no longer need it.
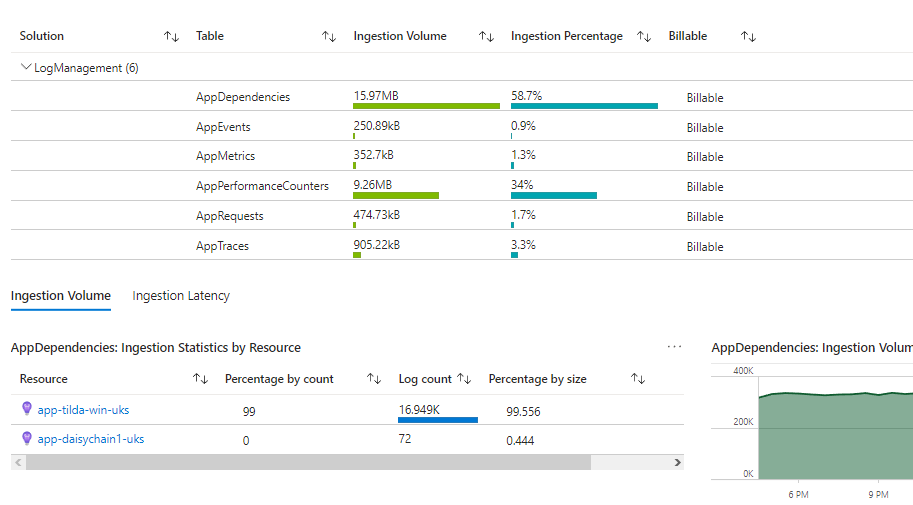
Ingestion and Costs
The Monitoring/Insights pages provide both an overview as well as a detailed breakdown of ingestion sources and volumes. This can be a good starting point for keeping tabs on your log storage costs. You can see breakdowns both by table as well as by resource:
Click on image to enlarge
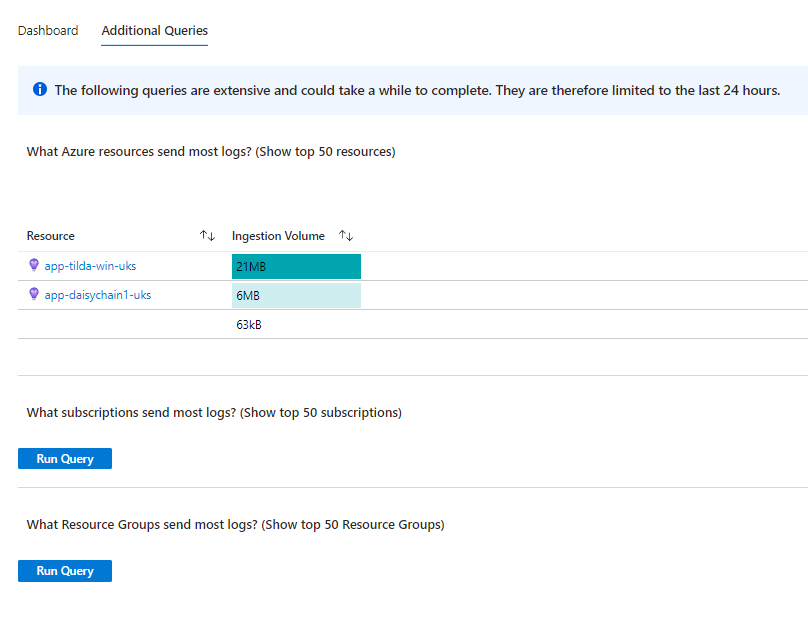
There are also some useful ready-to-run queries to help you slice and dice your ingestion stats:
Click on image to enlarge
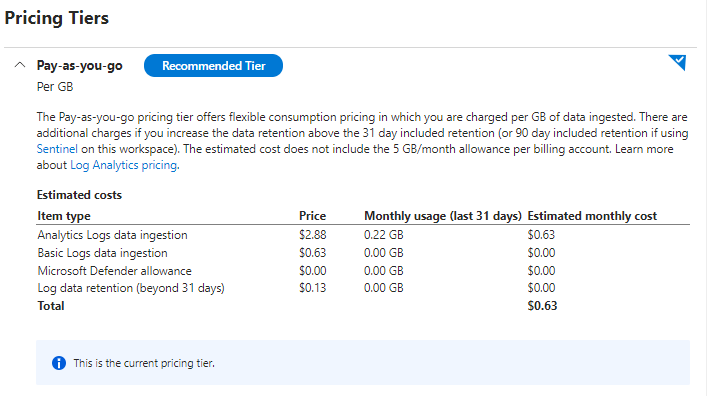
The Settings/Usage and estimated costs section does what it says on the tin. It will show you a table of your monthly costs for your current tier and enable you to compare that with other pricing tiers:
Click on image to enlarge
The screenshot above shows a very minimal monthly cost for our test subscription. If you are ingesting large volumes, however, costs can really soar. The 100GB per day tier will see you forking out the best part of $100k per year - or more depending on your usage.
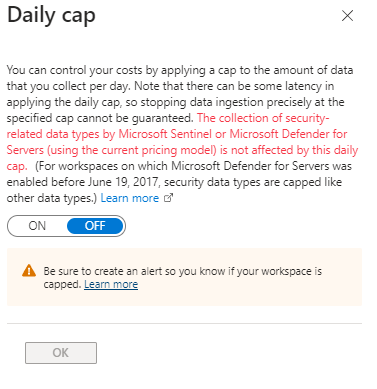
Luckily, Azure has tools for creating budgets and alerts so you can control costs and avoid nasty surprises. You can also set daily ingestion caps:
Click on image to enlarge
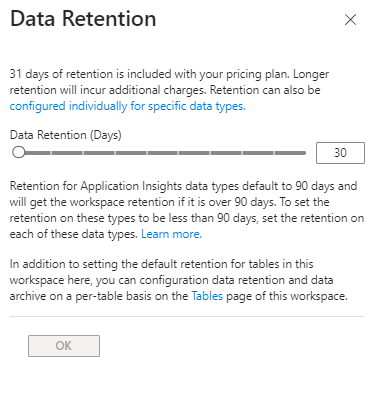
and set your retention policy at a global level:
Click on image to enlarge
Running a global instance
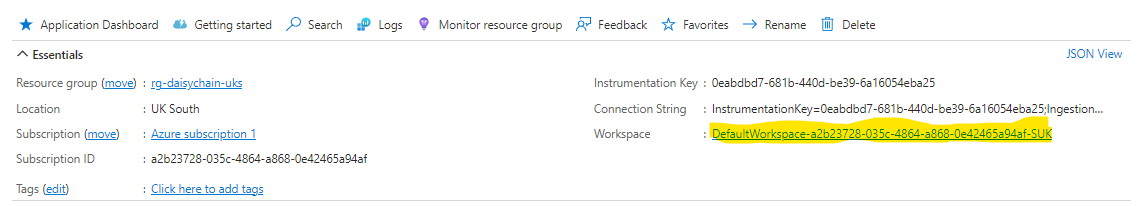
So far, we have looked at the typical pattern for running application insights - where each Web App has its own Application Insights instance. This is the most commonly used pattern. The downside is that, whilst we get rich insights and an intuitive UI, we don't have a single place where we can get an overview of either all our applications or a set of applications within a certain domain.
Even though the one-to-one mapping is the dominant approach, this does not mean that we cannot view multiple different apps within the same instance. As we have seen earlier, a Web App is linked to an Application Insights resource via an Instrumentation Key. There is no physical or technical impediment to assigning the same instrumentation key to multiple applications so that they all send their telemetry to the same endpoint. The question is, how will the Application Insights make sense of this? Will it be able to differentiate between different sources in the UI when we look at metrics and graphs. Let us see!
Set Up
We will start off by creating a standalone Application Insights instance.
Next, we will remove all of the Ai configuration from our existing applications
and then connect each of them to our new global instance.We will also create a number of new apps to try to create a more realistic simulation of a microservice system. We will add the following apps:
- oc-portal
- oc-pricing
- oc-sales
- oc-products
- oc-customer
- oc-orders
- oc-logistics
so we will have a total of 10 applications
Viewing metrics
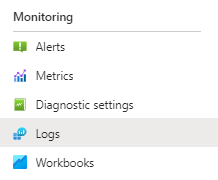
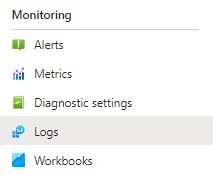
We will start by clicking on the Logs option of the Monitoring sidebar section:
Click on image to enlarge
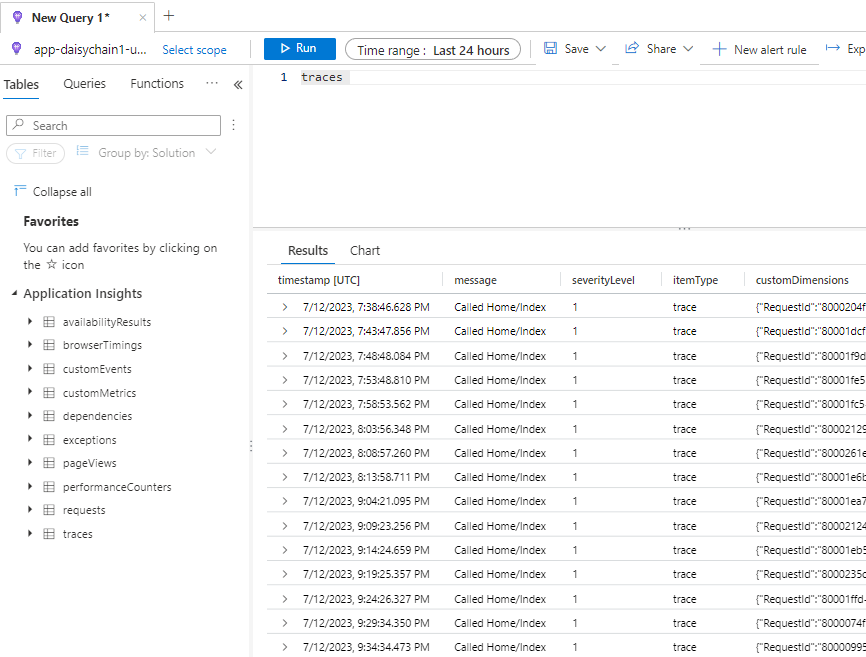
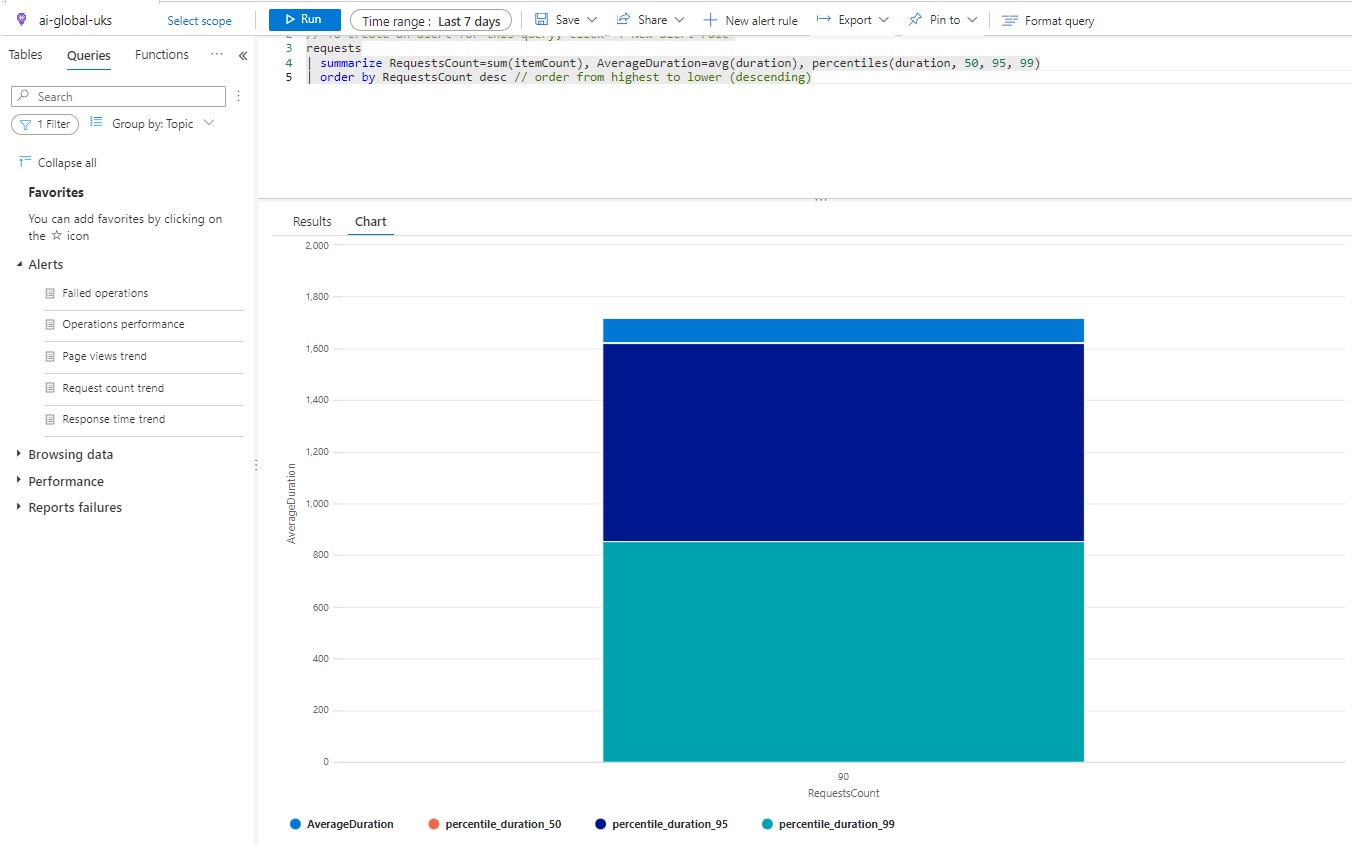
So lets imagine we are interested in viewing average response times for our Web Apps. We could run a very simple query like this:
Click on image to enlarge
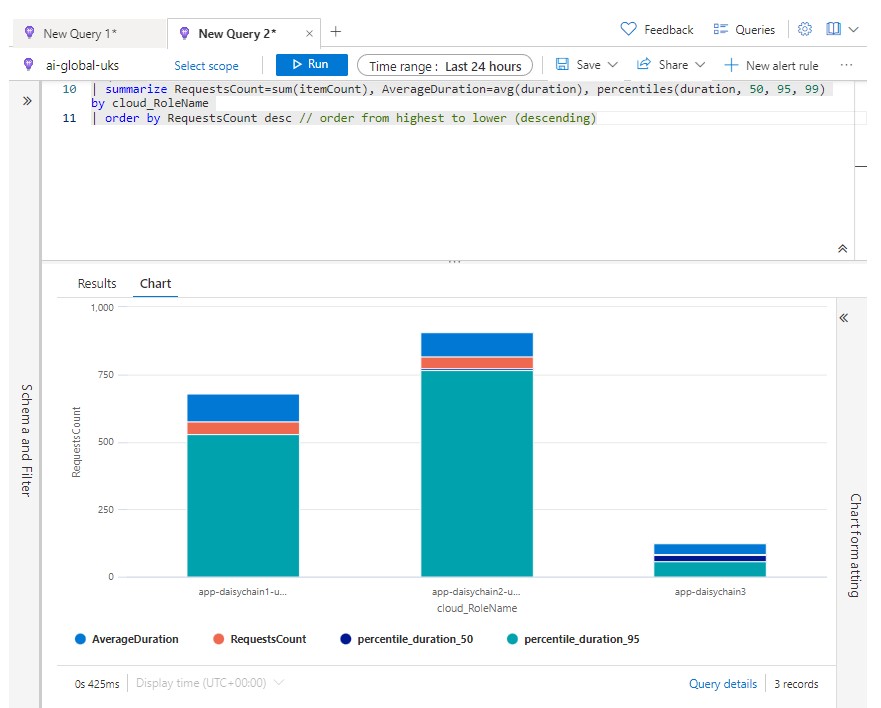
This is not very useful - it has just averaged out response times for all of the applications sending telemetry to this instance. Is there a telemetry attribute we can use for grouping our data by application? Well, it turns oiut that there is - we can use the cloud_Role_Name attribute for grouping - and suddenly our chart becomes much more informative:
Click on image to enlarge
This opens up all sorts of possibilities because it shows that the query engine is not tied to one-to-one mappings and will alow us to group our data flexibly, so that we can run reports and diagnostics across multiple app services within the context of a single Application Insights workspace.
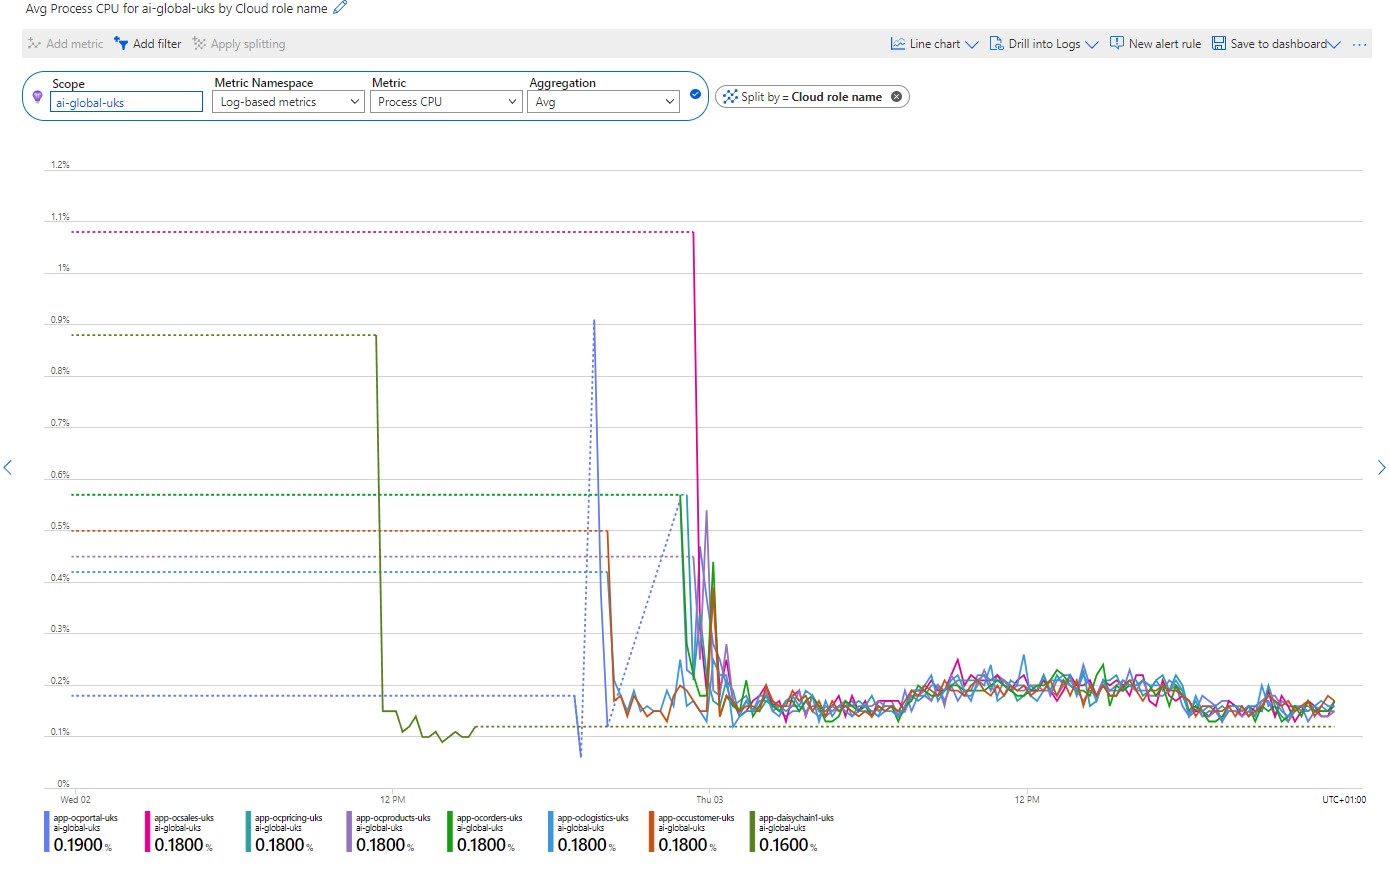
We can see the same principle in action below, where once again we are running a query and using the Apply Splitting option to group reults by cloud_RoleName - which essesntially resolves to the name that you have given to an App Service:
Click on image to enlarge
In this instance we are looking at CPU usage across a number of different apps. Whilst this is helpful in showing us the most cpu-hungry applications, it also has its limitations. Unfortunately it is not possibly to click on a line in the graph and drill down deeper into more metrics for the particular service.
For most of us, a principal concern will be to gain a overview of errors in our procudtion systems and then to be able to drill down into those errors. So, how does a global Application Insights instance deliver on this score?
Well, let's start by clicking on the Failures menu option in the Investigate section of the menu sidebar. The default view shows an overview across all of our applications:
Click on image to enlarge
Where things get interesting is when we look at Roles view. As we have said earlier, the cloud role refers to the logical application or service. Each cloud role maps to one or more instances - i.e. the physical server(s) on which the app is running. For a Web App, the instance is ephemeral and beyond our control. The instance name may be more valuable if you host your app services on Azure VM's or on your own infrastructure.
The cloud role name will default to the name you have given to your Web App. If you are using the Application Insights SDK you can override this using a TelemetryInitializer:
    public class CloudRoleNameTelemetryInitializer : ITelemetryInitializer
    {
        public void Initialize(ITelemetry telemetry)
        {
            // set custom role name here
            telemetry.Context.Cloud.RoleName = "Your Role Name";
        }
    }
The Roles view gives us a breakdown of Dependency Failures, Failed Requests and Total Exceptions for each application:
Click on image to enlarge
We can then expand the Cloud Role to view figures across each instance - but there is little value in this if you are running an app service
Click on image to enlarge
The same reservation would apply to the Metric deviations section on the upper right hand side of the page.
Click on image to enlarge
The figures here represent the average and standard deviation across the instances of individual web apps. They do not represent averages across Web Apps.Again, this is really only of value if you have access to the server instance.
Probably the main shortcoming of this view is that it only gives us totals. We can't drill down from those to see the detail of the actual exceptions or request failures. To understand the problem, let us look at our 'app-ocportal-uks' application. We can see that there are 35 failed requests and 30 exceptions.Clicking on that row, however, just expands the individual instances. If I click on the link for one of those instances I just get taken to the overview page for the Web App. If I click on the Application Insights link for that Web App I get a link to go to our global instance. So we end up going round a circle.
We can't drill down directly from this view. If I wanted to view errors for a specific application, I would need to go back to the Exceptions view and filter accordingly:
Click on image to enlarge
This kind of works but it is not the most elegant solution in terms of user experience. Until a time comes when we can create our own custom pages in Azure and pass in variables via our Http request, it does not seem possible for us to create our own custom drill-down functionality.
Appendix 2
App Service Metrics
| Metric |
Description |
| Response Time |
The time taken for the app to serve requests, in seconds. |
| Average Response Time (deprecated) |
The average time taken for the app to serve requests, in seconds. |
| Average memory working set |
The average amount of memory used by the app, in megabytes (MiB). |
| Connections |
The number of bound sockets existing in the sandbox (w3wp.exe and its child processes). A bound socket is created by calling bind()/connect() APIs and remains until said socket is closed with CloseHandle()/closesocket(). |
| CPU Time |
The amount of CPU consumed by the app, in seconds. For more information about this metric, see CPU time vs CPU percentage. |
| Current Assemblies |
The current number of Assemblies loaded across all AppDomains in this application. |
| Data In |
The amount of incoming bandwidth consumed by the app, in MiB. |
| Data Out |
The amount of outgoing bandwidth consumed by the app, in MiB. |
| File System Usage |
The amount of usage in bytes by storage share. |
| Gen 0 Garbage Collections |
The number of times the generation 0 objects are garbage collected since the start of the app process. Higher generation GCs include all lower generation GCs. |
| Gen 1 Garbage Collections |
The number of times the generation 1 objects are garbage collected since the start of the app process. Higher generation GCs include all lower generation GCs. |
| Gen 2 Garbage Collections |
The number of times the generation 2 objects are garbage collected since the start of the app process. |
| Handle Count |
The total number of handles currently open by the app process. |
| Health Check Status |
The average health status across the application's instances in the App Service Plan. |
| Http 2xx |
The count of requests resulting in an HTTP status code ≥ 200 but < 300. |
| Http 3xx |
The count of requests resulting in an HTTP status code ≥ 300 but < 400. |
| Http 401 |
The count of requests resulting in HTTP 401 status code. |
| Http 403 |
The count of requests resulting in HTTP 403 status code. |
| Http 404 |
The count of requests resulting in HTTP 404 status code. |
| Http 406 |
The count of requests resulting in HTTP 406 status code. |
| Http 4xx |
The count of requests resulting in an HTTP status code ≥ 400 but < 500. |
| Http Server Errors |
The count of requests resulting in an HTTP status code ≥ 500 but < 600. |
| IO Other Bytes Per Second |
The rate at which the app process is issuing bytes to I/O operations that don't involve data, such as control operations. |
| IO Other Operations Per Second |
The rate at which the app process is issuing I/O operations that aren't read or write operations. |
| IO Read Bytes Per Second |
The rate at which the app process is reading bytes from I/O operations. |
| IO Read Operations Per Second |
The rate at which the app process is issuing read I/O operations. |
| IO Write Bytes Per Second |
The rate at which the app process is writing bytes to I/O operations. |
| IO Write Operations Per Second |
The rate at which the app process is issuing write I/O operations. |
| Memory working set |
The current amount of memory used by the app, in MiB. |
| Private Bytes |
Private Bytes is the current size, in bytes, of memory that the app process has allocated that can't be shared with other processes. |
| Requests |
The total number of requests regardless of their resulting HTTP status code. |
| Requests In Application Queue |
The number of requests in the application request queue. |
| Thread Count |
The number of threads currently active in the app process. |
| Total App Domains |
The current number of AppDomains loaded in this application. |
| Total App Domains Unloaded |
The total number of AppDomains unloaded since the start of the application. |
Note
App Service plan metrics are available only for plans in Basic, Standard, and Premium tiers.
| Metric |
Description |
| CPU Percentage |
The average CPU used across all instances of the plan. |
| Memory Percentage |
The average memory used across all instances of the plan. |
| Data In |
The average incoming bandwidth used across all instances of the plan. |
| Data Out |
The average outgoing bandwidth used across all instances of the plan. |
| Disk Queue Length |
The average number of both read and write requests that were queued on storage. A high disk queue length is an indication of an app that might be slowing down because of excessive disk I/O. |
| Http Queue Length |
The average number of HTTP requests that had to sit on the queue before being fulfilled. A high or increasing HTTP Queue length is a symptom of a plan under heavy load. |
Source: https://learn.microsoft.com/en-us/azure/app-service/web-sites-monitor