Application Insights - opening up the SDK
Last updated: 2023-08-07
We have previously looked at using Application Insights in AutoInstrumented and Instrumented modes. Up to now we have looked at the features available out of the box. We have mostly concerned ourselves with functionality available via the Azure Portal through ther Application Insights UI and Azure Monitor. In addition to these visual tools Application Insights also includes a comprehensive SDK to support customisation, integration and advanced telemetry features.
As we have previously seen, the SDK is installed as a Nuget package and then initialised in the startup code in tour Program.cs file. We will now look at some of the use cases for using the SDk itself.
Note:
If you have previously used Application Insights in AutoInstrumented Mode and then switch to using the SDK you may notice some subtle but important differencers in behaviours. One of these is the way that logging works. When you use AutoInstrumentation, calls made to the Ilogger interface are automatically saved in the Application Insights traces table. When you use the SDK this no longer occurs automatically.
Service Options Configuration
The features that we use in the portal - or other visualisation tools are fed by telemetry generated by numerous different collectors built into the AI. Often these will take the form of modules - e.g. PerformanceCounterCollectionModule, RequestTrackingTelemetryModule, DiagnosticsTelemetryModule. Most of these modules are enabled by default. If, for some reason, you wish to disable them, you can use the SDK:
    var builder = WebApplication.CreateBuilder(args);

    var aiOptions = new Microsoft.ApplicationInsights.AspNetCore.Extensions.ApplicationInsightsServiceOptions();

    // Disables QuickPulse (Live Metrics stream).
    aiOptions.EnableQuickPulseMetricStream = false;

    builder.Services.AddApplicationInsightsTelemetry(aiOptions);
    var app = builder.Build();
In the example above, the Quick Pulse Metric Stream feature (which is used to display telemetry for CPU and memory in the Live Metrics view) has been disabled. Even though collecting this telemetry places very little burden on the host you might decide that, for performance reasons, you wish to turn it off.
One of the most important options you may wish to configure is the EnableAdaptiveSampling feature. Sampling is a simple concept to grasp but its implementation in telemetry solutions can be highly complex. Our servers generate events at the nano-second level and are continuously active. Capturing every possible metric and trace over every fraction of second would clearly be impractical and undesirable. At some point, therefore, we may have to sample our data.
Adaptive Sampling
In Application Insights Adaptive Sampling is enabled by default. This means that once the level of telemetry reaches a certain threshold sampling will kick in using its own pre-defined algorithm. This is an important point - If your application has a low volume of traffic and does not generate very large volumes of telemetry then sampling will probably not be triggered at all when the AdaptiveSampling option is enabled.
The decisions made by this algorithm may suit the 'average' user but may not be appropriate for every user or every situation. If you find that your logging costs are too high or your logs are just too busy you may want to look at re-calibrating your sampling rates.
There are a number of options at your disposal for calibrating the parameters for AdaptiveSmapling. This can be done in code using the UseAdaptiveSampling method of the TelemetryProcessorChainBuilder class. The default sampling rate is set to a maximum of 5 telemetry items per second but you can adjust this as follows:
    using Microsoft.ApplicationInsights;
    using Microsoft.ApplicationInsights.Extensibility;

    // ...

    var builder = TelemetryConfiguration.Active.DefaultTelemetrySink.TelemetryProcessorChainBuilder;

    // Enable AdaptiveSampling so as to keep overall telemetry volume to 5 items per second.
    builder.UseAdaptiveSampling(maxTelemetryItemsPerSecond:4);

    builder.Build();
Amongst the other common options you may wish to set are:
- MinSamplingPercentage
- MaxSamplingPercentage
- excludedTypes
- includedTypes
If you are setting included and excluded types you can use the same signature as in the example above:
builder.UseAdaptiveSampling(maxTelemetryItemsPerSecond: 5, excludedTypes: "Dependency", includedTypes: "Exception");
To set parameters such as the sampling percentage you need to use the SamplingPercentageEstimatorSettings class:
    using Microsoft.ApplicationInsights.WindowsServer.Channel.Implementation;

    telemetryProcessorChainBuilder.UseAdaptiveSampling(new SamplingPercentageEstimatorSettings
    {
            MinSamplingPercentage = 0.01,
            MaxSamplingPercentage = 100,
            MaxTelemetryItemsPerSecond = 5
        }, null, excludedTypes: "Dependency");
It appears this will only work on Windows hosts as the SamplingPercentageEstimatorSettings class has a dependency on the Microsoft.ApplicationInsights.WindowsServer.Channel.Implementation library.
Fixed Rate Sampling
As an alternative to adaptive sampling - which will vary the sampling rate according to conditions, you can opt for Fixed Rate Sampling. To do this you set your custom sampling rate and then turn off Adaptive Sampling. This uses the TelemetryProcessorChainBuilder we saw in one of our previous examples.
    var builder = WebApplication.CreateBuilder(args);

    builder.Services.Configure<TelemetryConfiguration>(telemetryConfiguration =>
    {
        var builder = telemetryConfiguration.DefaultTelemetrySink.TelemetryProcessorChainBuilder;

        // Using fixed rate sampling
        double fixedSamplingPercentage = 10;
        builder.UseSampling(fixedSamplingPercentage);
    });

    builder.Services.AddApplicationInsightsTelemetry(new ApplicationInsightsServiceOptions
    {
        EnableAdaptiveSampling = false,
    });

    var app = builder.Build();
As with AdaptiveSampling, when you use fixed rate sampling the processor will sample on the basis of OperationId. All operations with the same ID will be grouped together so that the sampling process does not create orphans and all steps in a related process are preserved.
Log Traces
As well as enabling fine grained control over configuration options, the SDK also provides extra layers of functionality for features such as tracing. The TrackTrace method allows you to send a trace message along with a dictionary of string values to provide additional support for debugging and diagnostics. You can also specify a severity level.
In the code sample below we are adding creating a trace message, setting a severity level of warning and also populating a string dictionary object.
    string messageId = "123456";
    _telemetryClient.TrackTrace("Added message to message bus",
    SeverityLevel.Warning,
    new Dictionary<string, string> { { "message bus", messageId } });
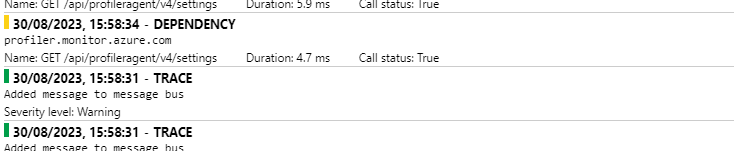
When the code is executed a new trace record will be added to the traces. When we go to Transaction Search in Application Insights we can see the record has been added as a trace:
Click on image to enlarge
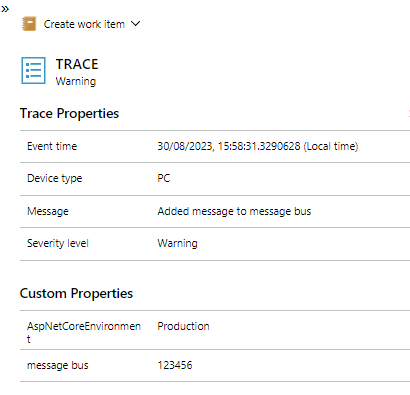
When we drill down we can verify that the properties we passed through in our dictionary object have been captured:
Click on image to enlarge
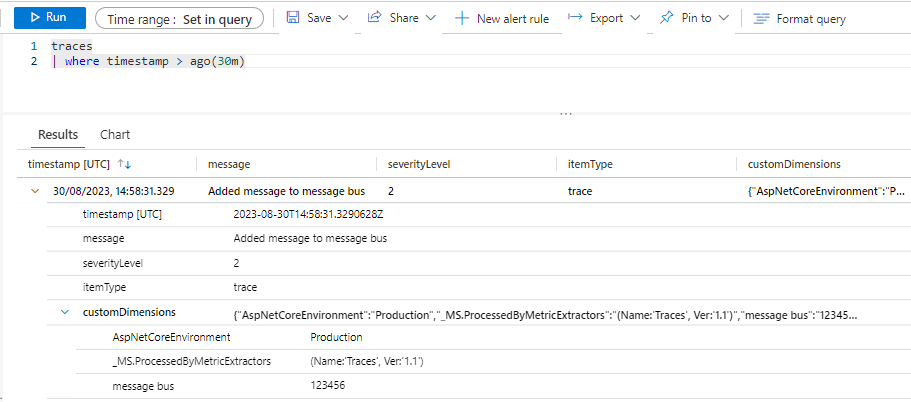
We can also run a simple Kusto query to view the details of our trace in the Application Insights traces table:
Click on image to enlarge
We can see here that the properties of our string dictionary are captured as Custom Dimensions
Architecture
Although the Application Insights SDK is shipped in a relatively small Nuget package, it is, nonetheless, a mature and richly featured telemetry solution with a sophisticated and customisable pipeline architecture.The three main pillars of this architecture are:
- Modules
- Initializers
- Processors
Modules
The starting point for the pipeline is the collection of the telemetry itself and this work is carried out by TelemetryModules. By default, the following automatic-collection modules are enabled. These modules are responsible for automatically collecting telemetry. You can disable or configure them to alter their default behavior.
RequestTrackingTelemetryModule: Collects RequestTelemetry from incoming web requests.DependencyTrackingTelemetryModule: Collects DependencyTelemetry from outgoing HTTP calls and SQL calls.PerformanceCollectorModule: Collects Windows PerformanceCounters.QuickPulseTelemetryModule: Collects telemetry to show in the Live Metrics portal.AppServicesHeartbeatTelemetryModule: Collects heartbeats (which are sent as custom metrics), about the App Service environment where the application is hosted.AzureInstanceMetadataTelemetryModule: Collects heartbeats (which are sent as custom metrics), about the Azure VM environment where the application is hosted.EventCounterCollectionModule: Collects EventCounters. This module is a new feature and is available in SDK version 2.8.0 and later.
To configure any default TelemetryModule, use the extension method ConfigureTelemetryModule<T> on IServiceCollection
If you wish to disable a particular module, you can do this quite easily in Services configuration logic in your program.cs file:
    // The following removes PerformanceCollectorModule to disable perf-counter collection.

    var performanceCounterService = builder.Services.FirstOrDefault<ServiceDescriptor>(t => t.ImplementationType == typeof(PerformanceCollectorModule));
    if (performanceCounterService != null)
    {
        builder.Services.Remove(performanceCounterService);
    }
Initialisers and Processors
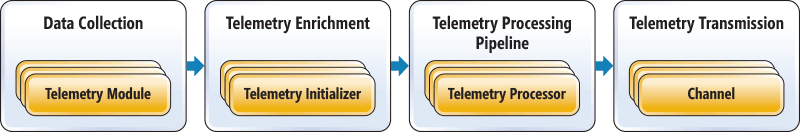
Sometimes we need to go beyond the realms of configuration and make changes at the source code level in order to achieve the results we desire. The Application Insights SDK includes Initializers and Processors to help with these more advanced senarios. To understand this, it might be useful to step back and consider the Application Insights telemetry pipeline:
Click on image to enlarge
Once the telemetry has been collected there are two types of operations we can apply before it is sent to the Application Insights endpoint. Initializers can be used to enrich the telemetry - for example by adding custom properties. The SDK ships with a set of pre-defined Initializers but developers can also create their own. Processors can be used for adding new functionality such as custom filters. For example, you may wish to filter out requests from robots or exclude requests for certain types of media. This allows you to control the volume of telemetry you transmit without compromising the value of your data or skewing your analytics.
Initializers
Initializers are a powerful tool for overriding or extending the built-in logic for how Application Insights manages telemetry. As you probably know, in order to enable the Application Insights SDK in an ASP.Net Core app, we add this line to our Program.cs file:
builder.Services.AddApplicationInsightsTelemetry();
If we dig down we can see that this apparently modest looking command actually triggers quite a lot of subroutines. Internally it makes the following two calls:
    AddAspNetCoreWebTelemetryInitializers(services);
    AddCommonInitializers(services);
The first call in the above code segment does quite a lot of work - launching no less than seven Telemetry Initializers:
    private static void AddAspNetCoreWebTelemetryInitializers(IServiceCollection services)
    {
        services.AddSingleton<ITelemetryInitializer, AzureAppServiceRoleNameFromHostNameHeaderInitializer>();
        services.AddSingleton<ITelemetryInitializer, ClientIpHeaderTelemetryInitializer>();
        services.AddSingleton<ITelemetryInitializer, OperationNameTelemetryInitializer>();
        services.AddSingleton<ITelemetryInitializer, SyntheticTelemetryInitializer>();
        services.AddSingleton<ITelemetryInitializer, WebSessionTelemetryInitializer>();
        services.AddSingleton<ITelemetryInitializer, WebUserTelemetryInitializer>();
        services.AddSingleton<ITelemetryInitializer, AspNetCoreEnvironmentTelemetryInitializer>();
    }
The second call spawns a further three Initializers:
    private static void AddCommonInitializers(IServiceCollection services)
    {
        services.AddSingleton<ITelemetryInitializer, Microsoft.ApplicationInsights.AspNetCore.TelemetryInitializers.DomainNameRoleInstanceTelemetryInitializer>();
        services.AddSingleton<ITelemetryInitializer, HttpDependenciesParsingTelemetryInitializer>();
        services.AddSingleton<ITelemetryInitializer, ComponentVersionTelemetryInitializer>();
    }
The Initializers themselves tend to be very lightweight classes which have a single purpose - i.e. populating values for telemetry items. In the example below you can see that the sole purpose of the ComponentVersionTelemetryInitializer class is, as the name suggests, to set the component version:
    public class ComponentVersionTelemetryInitializer : ITelemetryInitializer
    {
        private readonly string version;

        //
        // Summary:
        //     Initializes a new instance of the Microsoft.ApplicationInsights.AspNetCore.TelemetryInitializers.ComponentVersionTelemetryInitializer
        //     class.
        //
        // Parameters:
        //   options:
        //     Provides the Application Version to be added to the telemetry.
        public ComponentVersionTelemetryInitializer(IOptions<ApplicationInsightsServiceOptions> options)
        {
            if (options == null)
            {
                throw new ArgumentNullException("options");
            }

            version = options.Value.ApplicationVersion;
        }

        public void Initialize(ITelemetry telemetry)
        {
            if (telemetry == null)
            {
                throw new ArgumentNullException("telemetry");
            }

            if (string.IsNullOrEmpty(telemetry.Context.Component.Version) && !string.IsNullOrEmpty(version))
            {
                telemetry.Context.Component.Version = version;
            }
        }
    }
We will now look at creating our own Initializer. If you are running a web app then, by default, Application Insights will assign name of the web app as the CloudRoleName which is used to identify your application in the Application Insights portal and in Log analytics. If you wish, you can use an Initializer to change this behaviour.
First we will create a class which implements the ITelemetryInitializer interface:
    public class CloudRoleNameInitializer : ITelemetryInitializer
    {
        private string cloudRoleName = string.Empty;

        public CloudRoleNameInitializer(IOptions<AppSettings> appSettings)
        {
            cloudRoleName = appSettings.Value.CloudRoleName;
        }


        public void Initialize(ITelemetry telemetry)
        {
            telemetry.Context.Cloud.RoleName = cloudRoleName;
        }
    }
Then we add it to our services collection in Program.cs. In the above example we are using the Options pattern. We have defined a setting called CloudRoleName in our AppSettings.json file and giuven it the value "daisychain.web.1.0".
builder.Services.AddSingleton<ITelemetryInitializer, CloudRoleNameInitializer>();
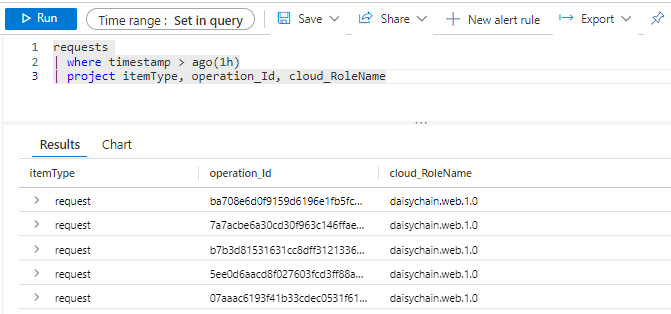
When a telemetry item is passing through the telemetry pipeline it will be passed to our Initializer, which will apply our custom value. Values defined by custom Initializers are not overwritten by the built-in Initializers. If we run our application and then query the requests table in Application Insights we can see that our custom cloud role name is now being used:
Click on image to enlarge
As well as setting values for built-in variables, we can also add custom properties to our telemetry. We do this using the Properties dictionary of the Telemetry object. We will update our code sample to populate a custom property called 'Partition':
    public void Initialize(ITelemetry telemetry)
    {
        telemetry.Context.Cloud.RoleName = cloudRoleName;

        var requestTelemetry = telemetry as RequestTelemetry;

        if (requestTelemetry == null)
        {
            return;
        }

        requestTelemetry.Properties["Partition"] = "P1234";
        }
    }
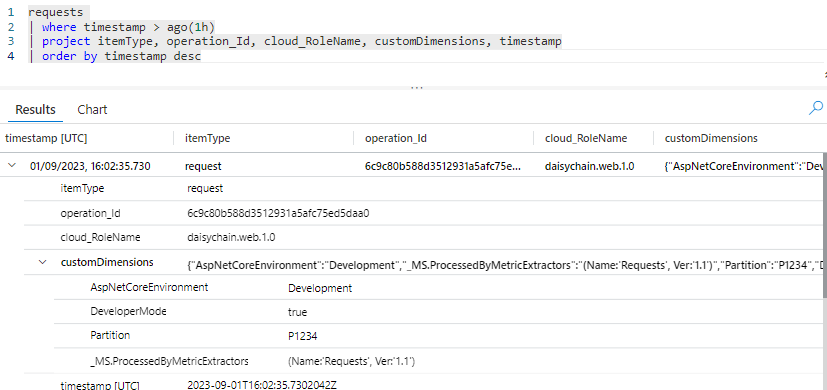
If we query the requests table again, we can now see our custom property contained in the CustomDimensions collection:
Click on image to enlarge
What makes these custom properties rally valuable is that we can use them in searches:
     requests
    | where timestamp > ago(1h)
    | where customDimensions.Partition == "P1234"
    | project itemType, operation_Id, cloud_RoleName, customDimensions, timestamp
    | order by timestamp desc
Processors
A cursory glance at the requests table in Application Insights reveals that a lot of telemetry that is logged relates to requests for static files such as images or files from third party libraries such as bootstrap. We might want to streamline our telemetry ingestion by excluding these file types. For filtering operations such as this we can use a custom Telemetry Processor. Processors inherit from ITelemetryProcessor and implement a process method. processors are daisychained together. If we wish to prevent an item from being passed along the pipeline we just terminate our custom Processor without invoking the next processor in the chain. Below is the code for our filter processor:
    public class ImageFilterProcessor : ITelemetryProcessor
        {
            private ITelemetryProcessor Next { get; set; }

            public ImageFilterProcessor(ITelemetryProcessor next)
            {
                Next = next;
            }

            public void Process(ITelemetry item)
            {

                List<string> extensions = new List<string> {"jpg", "png", "gif" };

                var requestTelemetry = item as RequestTelemetry;
                //filter out images
                if (requestTelemetry != null && extensions.Any(n => requestTelemetry.Name.EndsWith(n)))
                {
                    return;
                }

                // Send everything else to next processor
                this.Next.Process(item);
            }
        }
Next we just need to register the class in our start up code
builder.Services.AddApplicationInsightsTelemetryProcessor<ImageFilterProcessor>();
As you can see, this is a really simple and powerful method for regulating the volume of telemetry we create.
Conclusion
The Application Insights SDK may not be considered in the same breath as heavyweights such as DataDog and New Relic or open source stalwarts such as Prometheus or Grafana. Nevertheless, it still packs a punch. It is built on a simple but elegant object model and the pipeline architecture is highly flexible and accessible with powerful capabilities for filtering, extending and enriching your telemetry.
In this study we have looked at a range of approaches from using the SDK to make relatively simple configuration tweaks to more advanced tasks such creating our own Initializers and Processors. This is by no means an exhaustive account though and the SDK also provides tooling for advanced scenarios such as custom metrics and the creation of new Operation types. We will cover these in a future article.