Clickhouse In A Flash
ClickHouse is an incredibly fast and scalable SQL database that is rapidly growing in popularity. As well as being used as the backend for observability platforms such as SigNoz, GroundCover and HyperDX, it is also the data store for hyper-scalers such as Uber, eBay, Disney, Cloudflare any many more. You can opt to send your data to the ClickHouse cloud or self-host the OSS version. In this article we are going to look at how easy it is to run one of the world's most powerful databases on your desktop.
Sorry - No Windows!
if you are running ClickHouse on Docker on Windows then you can't mount a volume. If you do, then when ClickHouse tries to write to the volume it will fail, and you will encounter an error such as this:
Received exception from server (version 24.1.5):
Code: 1001. DB::Exception: Received from localhost:9000.
DB::Exception: std::__1::__fs::filesystem::filesystem_error:
filesystem error: in rename: Permission denied
["/var/lib/clickhouse/store/cd8/cd821f2c-d9a7-4b9e-a377-ee5638603510/tmp_insert_all_1_1_0/"]...
This is not a bug and there is no fix. ClickHouse does not support writing to non-Unix systems. Full stop.
At the moment, the only way to run ClickHouse on Windows and map a volume is to use the WSL.
In a production environment you would also certainly run ClickHouse on a Kubernetes cluster. For this exercise, we are just going to run the ClickHouse server locally on a Docker container. So, first of all, we will just pull the image:
docker pull clickhouse/clickhouse-serverAs you might expect, ClickHouse will need to write data and logs to a location on the host machine. We therefore need to map some volumes in our Docker run command. So, let's create some directories:
mkdir /var/lib/clickhouse
mkdir /var/log/clickhouse-server
And now we will execute the Docker run command
docker run -d --name clickhouse-server-01 -p 9000:9000 --ulimit nofile=262144:262144 -v /var/lib/clickhouse/:/var/lib/clickhouse/ -v /var/log/clickhouse-server/:/var/log/clickhouse-server/ clickhouse/clickhouse-server
In this example we are using the ulimit parameter to limit the maximum number of open files for this container to 262144. we are exposing port 9000 so that we can connect to it later from our host. Next, we can try connecting to our db:
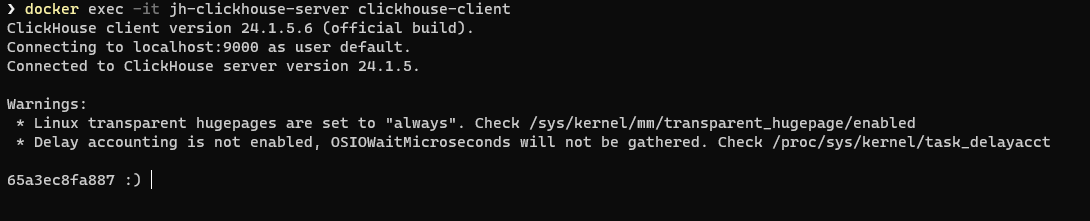
docker exec -it clickhouse-server-01 clickhouse-clientWe now have a connection to the ClickHouse client:
Creating A Database
Now that we are connected to the client we can start running some queries. First let's have a look at our default databases:
SHOW DATABASES;Obviously, if we want to use ClickHouse we will need a database and some data to populate it. We are going to use the New York Taxi data set - as recommended in the ClickHouse documentation. One cool aspect of the ClickHouse Insert statement is that it can pull data from a web Url.
The whole dataset consists of billions of records and is broken down into a number of files.
Next, we are going to create a database to store the data:
CREATE DATABASE IF NOT EXISTS TaxiDataNow we will make TaxiData our working database
Use TaxiDataNext, we will create our Trips table. To do this we will run the Create table script in Appendix 1. This script is taken from the ClickHouse tutorial: https://clickhouse.com/docs/en/tutorial
Inserting Data
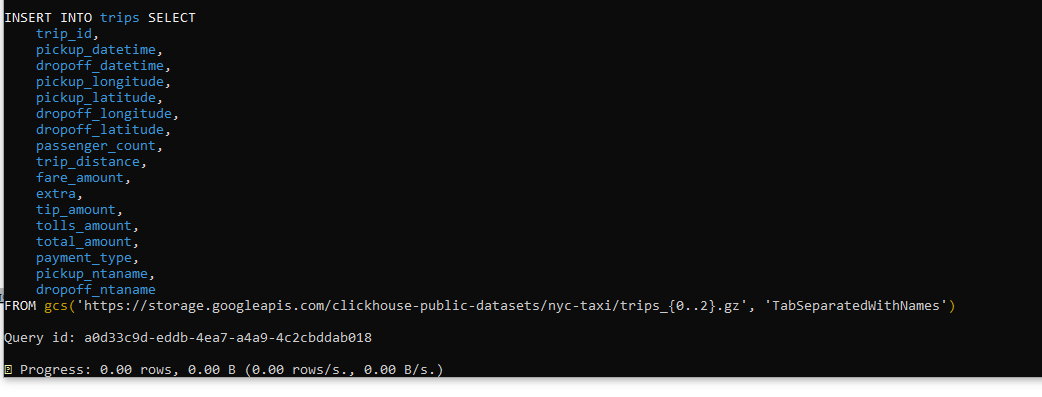
Our next task is to insert the data into our table.
    INSERT INTO trips SELECT
    trip_id,
    vendor_id,
    pickup_date,
    pickup_datetime,
    dropoff_date,
    dropoff_datetime,
    rate_code_id,
    pickup_longitude,
    pickup_latitude,
    dropoff_longitude,
    dropoff_latitude,
    passenger_count,
    trip_distance,
    fare_amount,
    extra,
    mta_tax,
    tip_amount,
    tolls_amount,
    ehail_fee,
    improvement_surcharge,
    total_amount,
    payment_type
    FROM gcs('https://storage.googleapis.com/clickhouse-public-datasets/nyc-taxi/trips_{0..2}.gz', 'TabSeparatedWithNames')
We can now watch the progress of our insert:

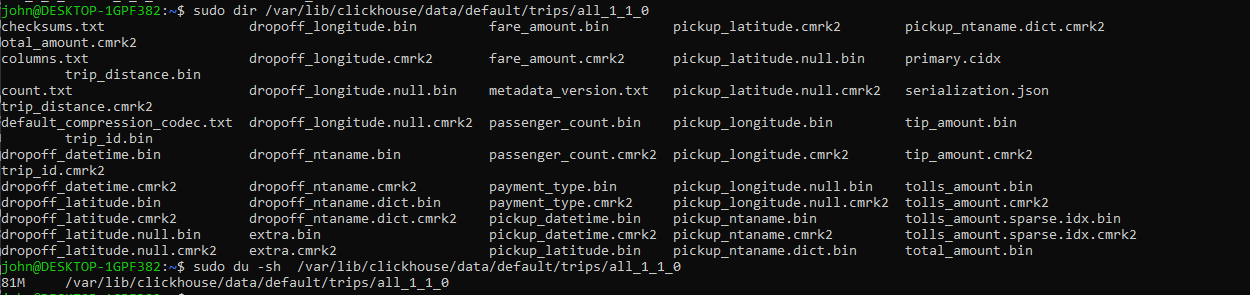
The image below also gives us an interesting insight into the internals of ClickHouse storage.
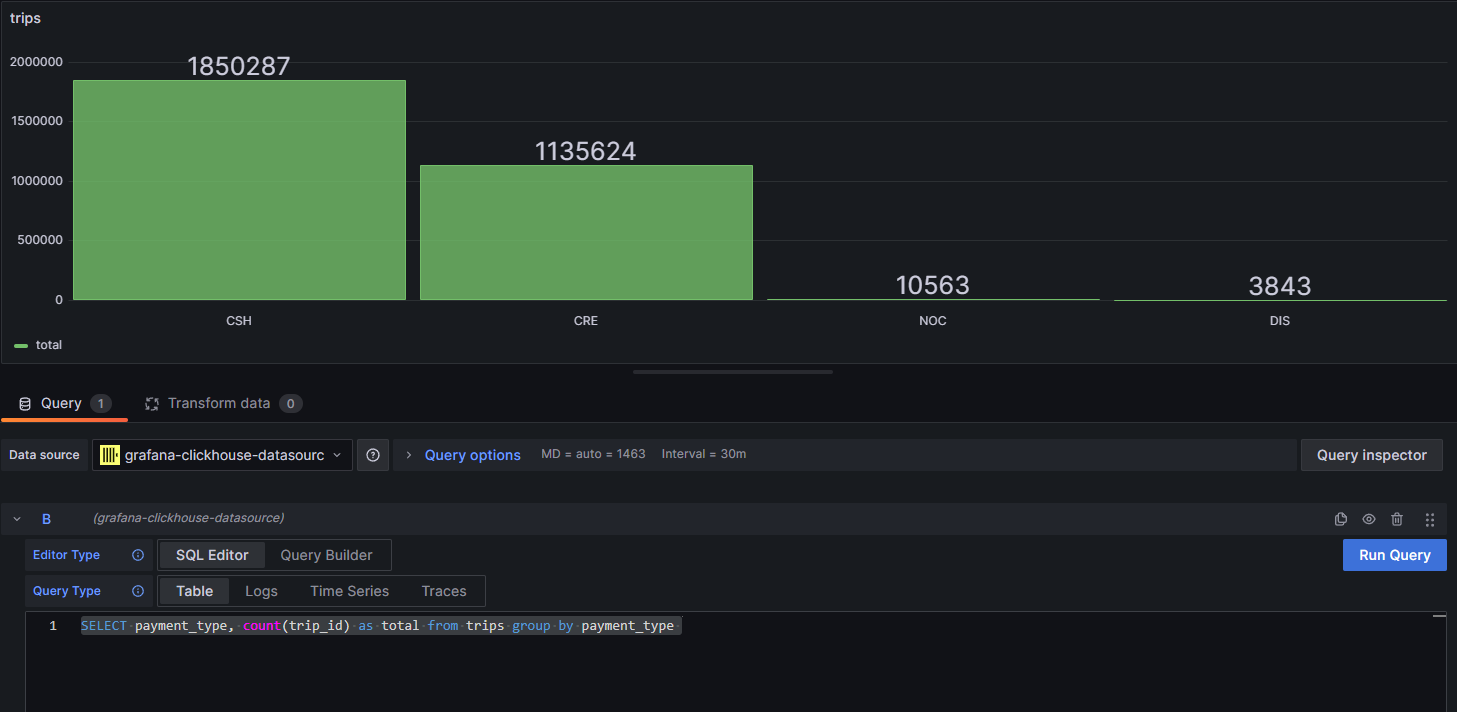
Now that we have our data inserted, we can start to play with it. This query shows the average fare based on the number of passengers:
SELECT
   passenger_count,
   avg(total_amount)
FROM trips
GROUP BY passenger_count;
This is the result of the query:
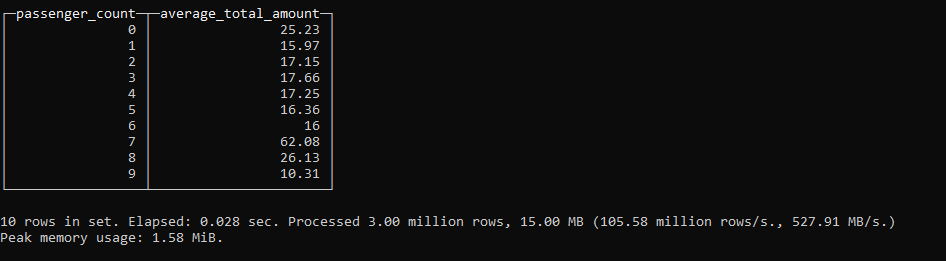
This is pretty impressive performance. This was run on a Docker container on a home server. It has processed 3 million rows in 0.028 seconds - a rate of 106 million rows per second.
Breaking The Rules
ClickHouse is a phenomenally fast and powerful database system. Whilst ClickHouse is not exactly an immutable database, it does not support the SQL update statement for updating the values of fields in one or more table rows.
You can, however, achieve the same effect by using the ALTER TABLE...UPDATE statement:
alter table trips update trip_id=trip_id + 3200000 where trip_id >0
The where clause in the above statement may seem a little redundant, however, this statement will not work without a where clause
alter table trips update pickup_datetime = dateadd(d,93,pickup_datetime)
    where trip_id >0

alter table trips update dropoff_datetime = dateadd(d,93,dropoff_datetime)
where trip_id >0
Whilst ClickHouse is extremely powerful, it naturally has some limitations. One point to remember is that it is designed as a large-sale analytics database. It is not designed for transaction processing, and it does not have support for ACID operations. It is designed for querying large datasets - it is not designed for querying or updating individual records. The guideline is that it is optimised for queries returning 8k+ rows. Equally, it is optimised for batch operations rather than a series of smaller queries.