Configuration
In this article we look at instrumenting a .Net web app running in Kubernetes to send logs to Loki. There are a couple of different architectural options for sending application logs to Loki. The two main approaches could be broken down as:
- use a tool such as Promtail
- forwarding logs via the OpenTelemetry Collector.
Naturally, we could actually mix the architecture up a bit further by actually configuring Promtail (or a similar tool) to send logs to the Gateway. In this article, we will be using the second approach - sending logs via the oTel collector.
Environment
We will be running our app services, our OpenTelemetry Collector and our Loki instances in an Azure Kubernetes Service (AKS) cluster.
Edition/Mode
We will be running the OSS edition of Loki in Simple Scalable Mode. The simple scalable deployment mode can scale up to a few TBs of logs per day. However, if you exceed this kind of volume, the microservices mode will be a better choice.
Loki on Azure
Installing Loki on Azure can initially be problematic. This is because the documentation in critical areas such as storage configuration tends to focus mostly on AWS and GCP, leaving Azure users to fend for themselves.
Naturally, the Grafana documentation is open source, so it is maybe incumbent on the Azure community to rectify this.
Installation
Before we start, we will need to create an Azure Storage Account. Once the Account has been created we will add a container called loki.
Next, in Kubernetes, we will create a namespace
kubectl create namespace loki
Then we will add the repo into Helm and get the latest version:
helm repo add grafana https://grafana.github.io/helm-charts

helm repo update
Next, we need to configure the storage values for our chart. We will do this by creating a custom values file. Create a new file called az-values.yaml and copy in the following:
loki:
  auth_enabled: false

  common:
    path_prefix: /var/loki

    ring:
      kvstore:
        store: memberlist

  storage:
    type: 'azure'

  compactor:
    working_directory: /var/loki/retention
    shared_store: azure
    retention_enabled: true

  schema_config:
    configs:
      store: boltdb-shipper
      object_store: azure
      schema: v11
      index:
        prefix: loki_index_
        period: 24h


  storage_config:
    boltdb_shipper:
      shared_store: azure
      active_index_directory: /var/loki/index
      cache_location: /var/loki/cache
      cache_ttl: 24h

    azure:
      container_name: loki
      account_name: <name>
      use_managed_identity: false
      account_key: <"key">
      request_timeout: 0

    filesystem:
      directory: /var/loki/chunks
monitoring:
  selfMonitoring:
    grafanaAgent:
      installOperator: false
In the example above we have set the value for "auth_enabled" to false. This is for the purposes of convenience but may not be appropriate to a production environment. Getting Loki up and running on Azure is not always straightforward and it can involve a fair amount of trial and error. You need to make sure that the values for each of the following attributes is set to 'azure':
- storage.type
- compactor.shared_store
- schema_config.configs.object_store
- storage_config.boltdb_shipper.shared_store
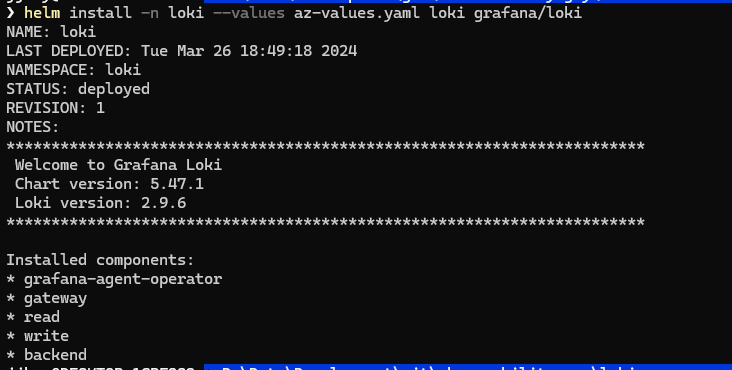
Now we will run our Helm install:
helm install -n loki --values az-values.yaml loki grafana/loki
If all goes well you should see a response like this:
Click on image to enlarge
Sending Telemetry
We now have our Loki instance up and running - the next thing we need to do is instrument a service so that it sends logs to our oTel Collector
In our service we have configured oTel logging as follows:
builder.Logging.AddOpenTelemetry(options =>
{
    options
        .SetResourceBuilder(
            ResourceBuilder.CreateDefault()
                .AddService(serviceName))
        .AddConsoleExporter()
        .AddOtlpExporter(options =>
        {
            options.Endpoint = new Uri($"{oTelCollectorUrl}");
            options.Protocol = OpenTelemetry.Exporter.OtlpExportProtocol.Grpc;
        });
});
Next, we need to configure values for our OpenTelemetry Helm Chart. Loki now has full support for OpenTelemetry. This means that we can now send logging telemetry to Loki using the oltphttp exporter (previously we used a dedicated Loki exporter). You can find documentation on this here.
As you can also see, we are sending our logs to the loki-write service.
For this exercise, we have switched off collection of Kubernetes metrics and logs. This is to make our telemetry streams more manageable, but this may not be an appropriate setting for a production environment. We have also created a Kubernetes service for our Collector, which runs in LoadBalancer mode. The annotations we have applied are Azure AKS specific and different notations will be needed for other cloud providers.
You will see that in the config/processors/resource section we have defined a number of attributes. These will be surfaced in Loki as labels. We can then use these for organising and querying our logs. As you can see, we have used the from_attribute keyword for renaming existing attributes and have used the value keyword for creating new attributes.
mode: daemonset
presets:
  # enables the k8sattributesprocessor and adds it to the traces, metrics, and logs pipelines
  kubernetesAttributes:
    enabled: false
  # enables the kubeletstatsreceiver and adds it to the metrics pipelines
  kubeletMetrics:
    enabled: false
  # Enables the filelogreceiver and adds it to the logs pipelines
  logsCollection:
    enabled: false
## The chart only includes the loggingexporter by default
## If you want to send your data somewhere you need to
## configure an exporter, such as the otlpexporter
config:
  exporters:
    otlphttp:
      endpoint: "http://loki-write.loki.svc.cluster.local:3100/loki/api/v1/push"
      tls:
        insecure: true

  processors:
    resource:
      attributes:
        - action: insert
          key: language
          from_attribute: telemetry.sdk.language
        - action: insert
          key: service_name
          from_attribute: service.name
        - action: insert
          key: service_namespace
          from_attribute: service.namespace
        - action: insert
          key: service_version
          value: 1.000
        - action: insert
          key: deployment_environment
          value: production
        - action: insert
          key: loki.resource.labels
          value: language,service_name,service_namespace,service_version,deployment_environment
  service:
    telemetry:
      logs:
        level: "debug"
    pipelines:
     logs:
       exporters: [ loki, debug ]
       processors: [batch, resource]
       receivers: [ otlp ]
service:
  # Enable the creation of a Service.
  # By default, it's enabled on mode != daemonset.
  # However, to enable it on mode = daemonset, its creation must be explicitly enabled
  enabled: true

  type: LoadBalancer
  loadBalancerIP: ""
  annotations:
    service.beta.kubernetes.io/azure-load-balancer-internal: "true"
We can now install the OpenTelemetry Helm repo
helm repo add open-telemetry https://open-telemetry.github.io/opentelemetry-helm-charts

helm repo update
And deploy the Collector to our cluster:
kubectl create namespace otel-collector

helm install otel-collector open-telemetry/opentelemetry-collector --values values.yml
Grafana
We now have our microservices, our oTel Collector and our Loki instance running. The next thing we will do is spin up an instance of Grafana that we can use for viewing and querying our log data. Since the purpose of this exercise is to focus on Loki, we will restrict ourselves to running a simple Grafana set up, following the instructions on this page.
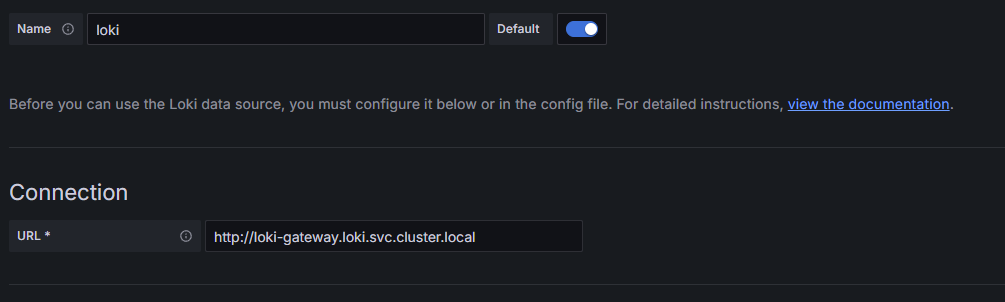
Once Grafana is up and running, we first of all need to connect to our Loki Data Source. This is just a matter of pointing to the url for our Loki Gateway service. Since we have have installed Loki in a namespace we enter the fully qualified path: http://loki-gateway.loki.svc.cluster.local.
Grafana Config
Click on image to enlarge
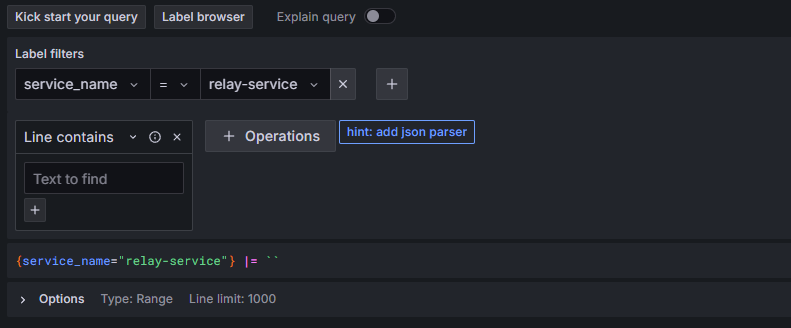
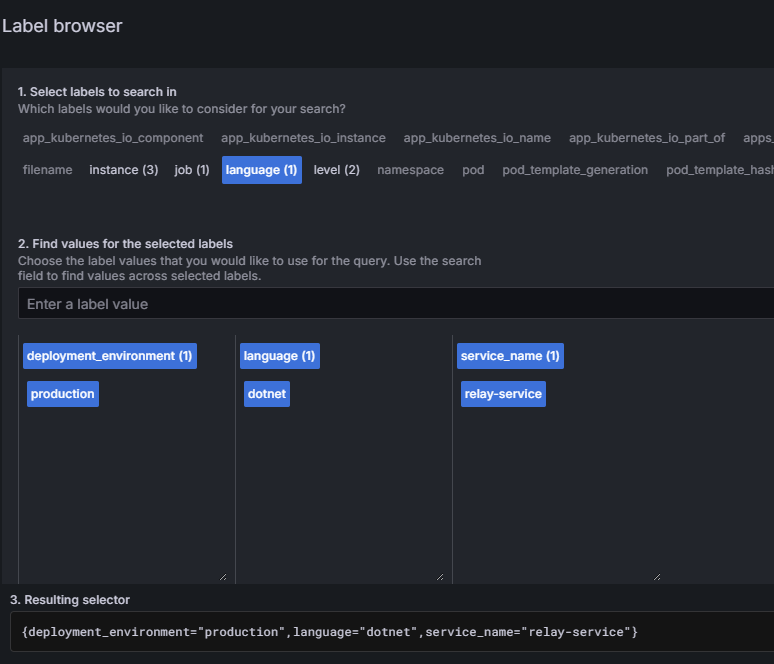
Now we can look at our log data. We are going to view logs for our relay service - so we will filter the labels by service name:
Click on image to enlarge
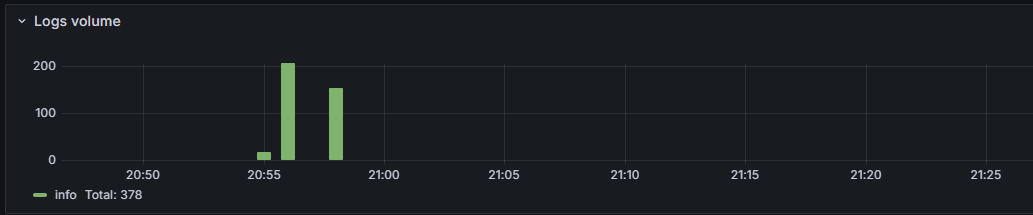
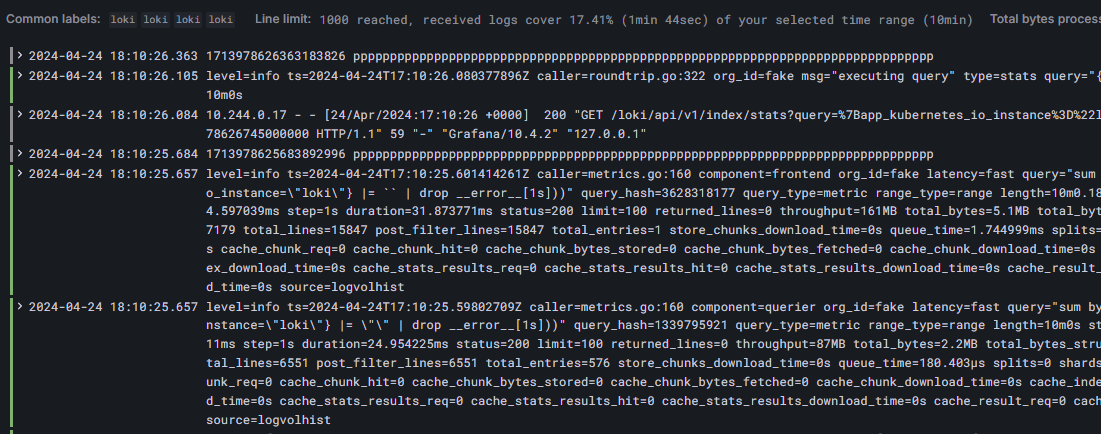
Once we click on the Run Query button we will see a bar chart of our logging volumes
Click on image to enlarge
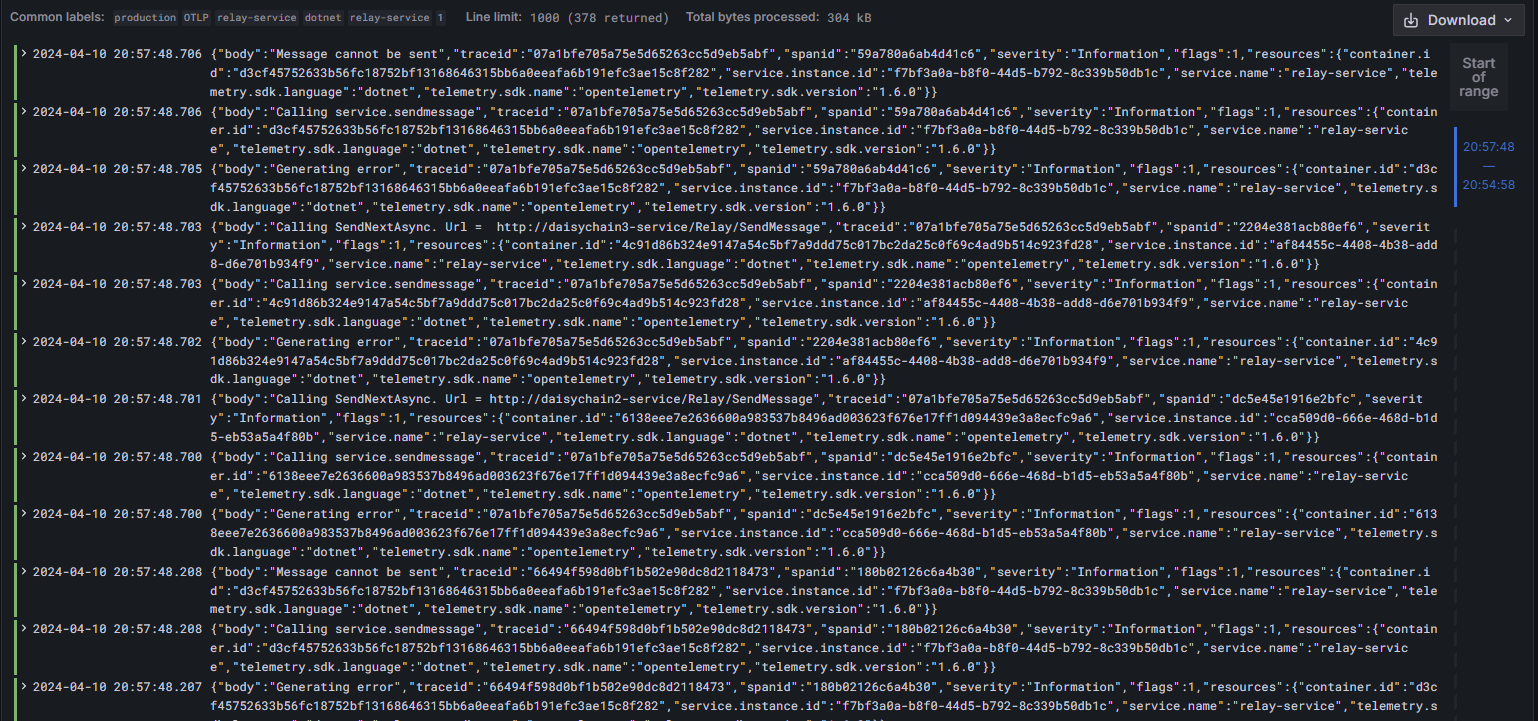
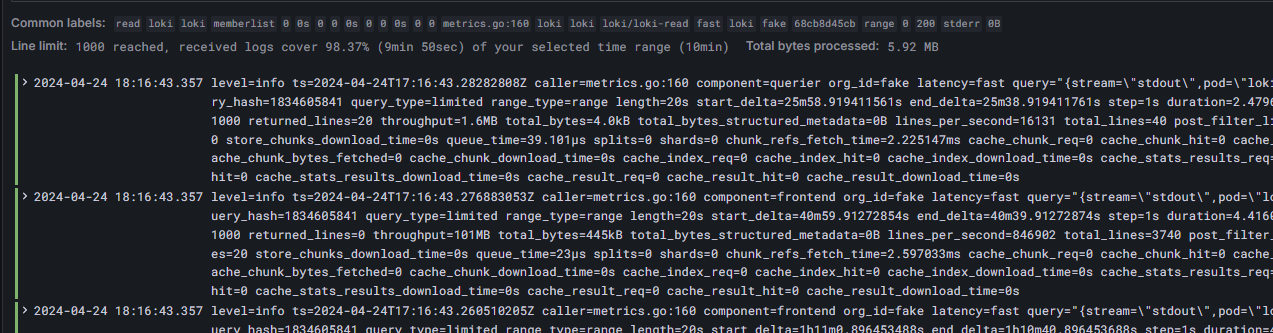
as well as a panel with multiple viewing options for our raw log data.
Click on image to enlarge