
OpenTelemetry for .NET
The OpenTelemetry project is a major step forward for the observability community. The vision behind OpenTelemetry is to create consistent standards, interfaces and protocols across vendors to simplify observability integrations and implementations. A huge amount of work has gone into defining concepts and frameworks and there are now SDKs available for a range of runtimes and platforms.
Microsoft has declared its support for OpenTelemetry's goals and has backed this up with active participation in the initiative. In this article we are going to have a look at how adoption of OpenTelemetry will impact on cloud applications built in Asp.Net Core.
OpenTelemetry SDKs for .NET
Not one SDK - but two!
OpenTelemetry is a very broad undertaking - it encompasses specifications, API's, Protocols and SDK's. The SDK's, as you might expect, provide implementations for functionality defined in the Specifications. At the present time, there are SDK's for Python, Node.js, Java and, of course .NET. Just to complicate matters, Microsoft have also released the Azure Monitor OpenTelemetry Distro - which we will review in a separate article.OpenTelemetry AutoInstrumentation for .NET
OpenTelemetry for .NET can be implemented in two different modes - AutoInstrumented or manual. If you are familiar with AutoInstrumentation for .Net Core web apps with Application Insights, then the OpenTelemetry implementation may seem somewhat foreign. This though is because Microsoft do the heavy lifting behind the scenes for AutoInstrumentation in Application Insights. With OpenTelemetry, the plumbing is, by necessity, out in the open.
Let us have a look at the sample code in the OpenTelemetry docs (https://opentelemetry.io/docs/instrumentation/net/getting-started/). The sample code is a walkthrough of creating a (very minimal) Minimal API. First of all without instrumentation, and then with. The sample code we are using is the flavour for running OpenTelemetry on a .Net Core app in Windows.
The first step is to create a new directory called dotnet-simple. Within that directory, execute following command:
dotnet new web
In the same directory, replace the content of Program.cs with the following code:
using System.Globalization;

var builder = WebApplication.CreateBuilder(args);
var app = builder.Build();

var logger = app.Logger;

int RollDice()
{
    return Random.Shared.Next(1, 7);
}

string HandleRollDice(string? player)
{
    var result = RollDice();

    if (string.IsNullOrEmpty(player))
    {
        logger.LogInformation("Anonymous player is rolling the dice: {result}", result);
    }
    else
    {
        logger.LogInformation("{player} is rolling the dice: {result}", player, result);
    }

    return result.ToString(CultureInfo.InvariantCulture);
}

app.MapGet("/rolldice/{player?}", HandleRollDice);

app.Run();
In the Properties subdirectory, replace the content of launchSettings.json with the following:
    {
  "$schema": "http://json.schemastore.org/launchsettings.json",
  "profiles": {
    "http": {
      "commandName": "Project",
      "dotnetRunMessages": true,
      "launchBrowser": true,
      "applicationUrl": "http://localhost:8080",
      "environmentVariables": {
        "ASPNETCORE_ENVIRONMENT": "Development"
      }
    }
  }
}
Build and run the application with the following command
 dotnet build
 dotnet run
This will produce an output something like this in your console:
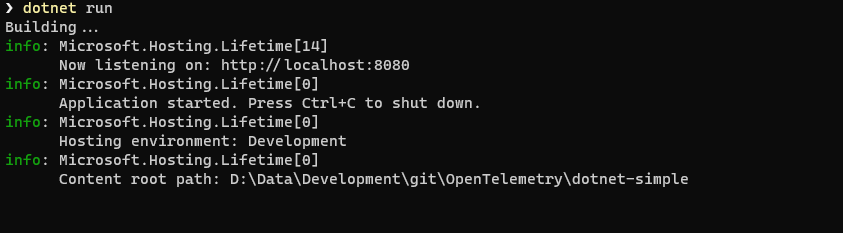
So far so unexceptional. This is just the normal behaviour you would expect when starting a .NET app. Now it's time to stir in the OpenTelemetry sauce. You need to be running a Powershell session with admin privileges for the following commands. The first snippet here just downloads the installation scripts from the OpenTelemetry repository in Github:
$module_url = "https://github.com/open-telemetry/opentelemetry-dotnet-instrumentation/releases/latest/download/OpenTelemetry.DotNet.Auto.psm1"
$download_path = Join-Path $env:temp "OpenTelemetry.DotNet.Auto.psm1"
Invoke-WebRequest -Uri $module_url -OutFile $download_path -UseBasicParsing
The path $env:temp will resolve to something like C:\Users\<currentuser>\AppData\Local\Temp. Next, you need to import the Powershell Module and install the OpenTelemetry .NET SDK.
Import-Module $download_path
Install-OpenTelemetryCore
These two lines of code maybe short but it is worth just unpacking what they are doing. The Import-Module command seems pretty straightforward - it is importing the module OpenTelemetry.DotNet.Auto into Powershell. It is worth remembering that importing is not the same as installing. In this instance, the command is just making the module embodied in the OpenTelemetry.DotNet.Auto.psm1 file available for the current Powershell session. As we noted above, the file has been downloaded to the current user's temp folder. This means that it is only available to the current user and that it has not been installed as a permanent Powershell component. Each time you want to invoke the functionality you would need to first of all execute these two lines of code:
$download_path = Join-Path $env:temp "OpenTelemetry.DotNet.Auto.psm1"
Import-Module $download_path
Install-OpenTelemetryCore is a function which resides in the OpenTelemetry.DotNet.Auto.psml we have downloaded. If we look at its signature, we can see that it is possible to provide a parameter for the installation directory.
    function Install-OpenTelemetryCore() {
    param(
        [Parameter(Mandatory = $false)]
        [string]$InstallDir = "<auto>",
        [Parameter(Mandatory = $false)]
        [string]$LocalPath
    )
If you don't provide a paramater then (on Windows) the install directory will default to C:\Program Files\OpenTelemetry .NET AutoInstrumentation\net. As a point of interest, the install does not just unzip and copy the OpenTelemetry dlls, it also registers them in the GAC.
The next block of code sets a number of environment variables and then 'registers' the current session for OpenTelemetry. These environment variables are scoped to the current Powershell session only. They have no impact on machine wide settings or even for any other Powershell sessions running on the current host.
    $env:OTEL_TRACES_EXPORTER="none"
    $env:OTEL_METRICS_EXPORTER="none"
    $env:OTEL_LOGS_EXPORTER="none"
    $env:OTEL_DOTNET_AUTO_TRACES_CONSOLE_EXPORTER_ENABLED="true"
    $env:OTEL_DOTNET_AUTO_METRICS_CONSOLE_EXPORTER_ENABLED="true"
    $env:OTEL_DOTNET_AUTO_LOGS_CONSOLE_EXPORTER_ENABLED="true"
    Register-OpenTelemetryForCurrentSession -OTelServiceName "RollDiceService"
If you then run your application again:
dotnet run
You will now see OpenTelemetry in action - there will be a stream of telemetry sent to the console. It will look something like the output below.
Note.
Note
One point of interest here is the use of the term 'Activity'. In the .NET lexicon of observability, an Activity is analagous to a Span. This is not a case of Microsoft wanting to be a bit special or being a bit petulant. It simply reflects that Microsoft have been using the term in their libraries since the days before the term 'Span' was established.
LogRecord.Timestamp:               2023-08-14T06:44:53.9279186Z
LogRecord.TraceId:                 3961d22b5f90bf7662ad4933318743fe
LogRecord.SpanId:                  93d5fcea422ff0ac
LogRecord.TraceFlags:              Recorded
LogRecord.CategoryName:            simple-dotnet
LogRecord.LogLevel:                Information
LogRecord.StateValues (Key:Value):
    result: 1
    OriginalFormat (a.k.a Body): Anonymous player is rolling the dice: {result}

Resource associated with LogRecord:
service.name: simple-dotnet
telemetry.auto.version: 0.7.0
telemetry.sdk.name: opentelemetry
telemetry.sdk.language: dotnet
telemetry.sdk.version: 1.4.0.802

info: simple-dotnet[0]
      Anonymous player is rolling the dice: 1
Activity.TraceId:            3961d22b5f90bf7662ad4933318743fe
Activity.SpanId:             93d5fcea422ff0ac
Activity.TraceFlags:         Recorded
Activity.ActivitySourceName: OpenTelemetry.Instrumentation.AspNetCore
Activity.DisplayName:        /rolldice
Activity.Kind:               Server
Activity.StartTime:          2023-08-14T06:44:53.9278162Z
Activity.Duration:           00:00:00.0049754
Activity.Tags:
    net.host.name: localhost
    net.host.port: 8080
    http.method: GET
    http.scheme: http
    http.target: /rolldice
    http.url: http://localhost:8080/rolldice
    http.flavor: 1.1
    http.user_agent: curl/8.0.1
    http.status_code: 200
Resource associated with Activity:
    service.name: simple-dotnet
    telemetry.auto.version: 0.7.0
    telemetry.sdk.name: opentelemetry
    telemetry.sdk.language: dotnet
    telemetry.sdk.version: 1.4.0.802
Getting Hooked on .Net Core
You may be wondering what alchemy has occurred to suddenly send all this telemetry to the console. Well, the answer is that the Register-OpenTelemetryForCurrentSession function used a .NET StartUp Hook. As the name suggests, StartUp Hooks are a means of injecting a method from another assembly into a .Net Core application when it starts up. The Powershell module defines the Startup Hook string with this statement:
$DOTNET_STARTUP_HOOKS = Join-Path $InstallDir "net/OpenTelemetry.AutoInstrumentation.StartupHook.dll"
That string is then fed into the environment variables for our application. Given that we can effectively inject OpenTelemetry into our .Net Core app using a hook we could actually simplify our setup a little bit and avoid having to use the Powershell module. We could break the process into two parts. Firstly, download the SDK and install it into a location where it will be available for all apps on the host. Secondly, have a simple script that sets environment variables and then runs our application. We have created a couple of very simple scripts for this in our Github Repo.
We will use the following Powershell script to download the OpenTelemetry .NET SDK and then extract it to a custom location on our C: drive
    $archive = "opentelemetry-dotnet-instrumentation-windows.zip"
    $version = "v1.0.0"
    $dlUrl = "https://github.com/open-telemetry/opentelemetry-dotnet-instrumentation/releases/download/$Version/$archive"
    $path = "C:\temp\openTel"
    $dlPath = Join-Path $Path $archive
    $InstallDir = "C:\Tools\OpenTel"
    Invoke-WebRequest -Uri $dlUrl -OutFile $dlPath -UseBasicParsing

    Expand-Archive $dlPath $installDir -Force
We only have to run that script once on any host. Next we start our application with OpenTelemetry AutoInstrumentation:
    $env:OTEL_TRACES_EXPORTER="none"
    $env:OTEL_METRICS_EXPORTER="none"
    $env:OTEL_LOGS_EXPORTER="none"
    $env:OTEL_DOTNET_AUTO_TRACES_CONSOLE_EXPORTER_ENABLED="true"
    $env:OTEL_DOTNET_AUTO_METRICS_CONSOLE_EXPORTER_ENABLED="true"
    $env:OTEL_DOTNET_AUTO_LOGS_CONSOLE_EXPORTER_ENABLED="true"

    $DOTNET_STARTUP_HOOKS = "C:\tools\OpenTel\net\OpenTelemetry.AutoInstrumentation.StartupHook.dll"

    $env:DOTNET_STARTUP_HOOKS = $DOTNET_STARTUP_HOOKS
This has the advantage of making the process a bit more repeatable. It also means that we do not need to download the Powershell module or even run our Powershell session with admin privileges. There is obviously further scope for experimentation with this approach. For example, once you have extracted the zip archive you could remove any dlls you don't need.
Now that we have a sample created, we can start to see some of the power and flexibility of OpenTelemetry. At the moment we have configured our traces to be sent to the console. This is great for testing and debugging but in a production scenario we want to send our traces to a collector where they can be viewed.
Adding A Zipkin Collector
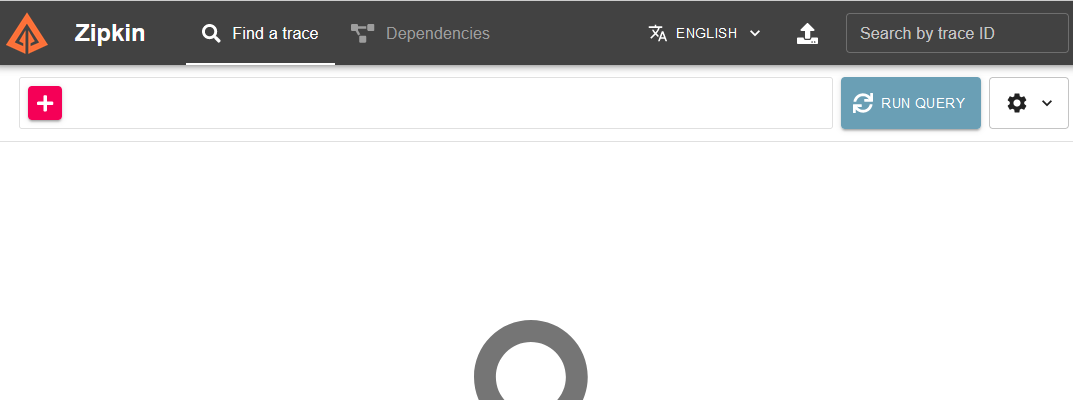
One of the most popular tools for gathering and visualising traces is Zipkin. Running Zipkin locally is a breeze as they have an image in the Docker Hub which is all ready to run. You just need to run this command in in your terminal:
docker run -d -p 9411:9411 openzipkin/zipkin
The load time for this image is very fast and if you navigate to port 9411 in your browser, you should see Zipkin up and running.
Zipkin will also be listening for trace submissions on port 9411. In order to send our traces to zipkin we just need to update our OTEL_TRACES_EXPORTER environment variable:
$env:OTEL_TRACES_EXPORTER="zipkin"
We will now refresh the environment variables
.\initApp.ps1
and run the app again:
dotnet run
Our service has registered itself with the name /rolldice. If we search for this service name in Zipkin we will now see our traces:
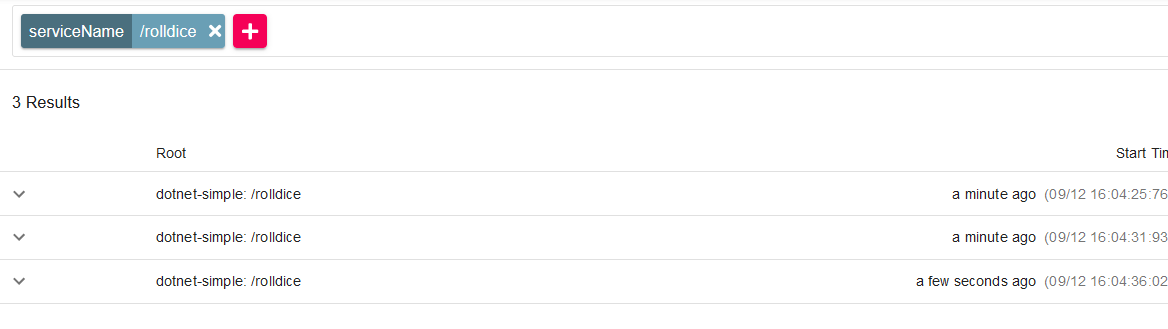
This really shows the magic of the OpenTelemetry SDK - we can achieve seamless interop with an almost negligible amount of configuration or effort. The mechanics of this are actually pretty simple. The OpenTelemetry Automation StartUpHook detected that we had defined Zipkin as our Traces Exporter. It therefore instantiated the .NET Zipkin exporter, which collected our telemetry and submitted it to our Zipkin endpoint. By default, the Zipkin exporter will export to http://localhost:9411/api/v2/spans". For us, this is convenient as our Zipkin Docker container just happened to be running on localhost:9411. If your Zipkin endpoint has a different location you can define this with an environment variable:
$ENV:OTEL_EXPORTER_ZIPKIN_ENDPOINT="http://localhost:9411/api/v2/spans"
In this article we have looked at AutoInstrumentation for .Net Core applications and seen that we can leverage considerable power from OpenTelemetry without having to make any changes at all to our code base. Next, we will look at initialising the OpenTelemetry SDK in our source code.
References
https://learn.microsoft.com/en-us/dotnet/core/diagnostics/observability-with-otel
https://opentelemetry.io/docs/instrumentation/net/getting-started/
https://github.com/open-telemetry/opentelemetry-dotnet
Acknowledgements
Thank you very much to Cijo Thomas and Piotr Kielkowicz for their comments and corections via the CNCF/OpenTelemetry Slack channel