.NET Configuration
OpenTelemetry Packages
The first thing we need to do is add the relevant OpenTelemetry packages to our project. These are:
- OpenTelemetry.Extensions.Hosting 1.60
- OpenTelemetry.Instrumentation.AspNetCore 1.60-rc.1
- OpenTelemetry.Instrumentation.Process 0.5.0-beta.3
- OpenTelemetry.Exporter.Console 1.60
- OpenTelemetry.Exporter.OpenTelemetryProtocol 1.60
What the Packages Do
OpenTelemetry.Extensions.Hosting
This is used for hosting the OpenTelemetry context whilst our application is running.
OpenTelemetry.Instrumentation.AspNetCore
This, as the name suggests, captures telemetry specific to Asp.Net core such as Http Requests.
OpenTelemetry.Instrumentation.Process
This captures more general .Net process telemetry - such as performance and errors.
Exporters
We can configure multiple exporters to send our telemetry to different endpoints. We will use the OpenTelemetryProtocol exporter to send telemetry to our Collector.
As you can see, instrumenting our application is not simply a matter of including one monolithic package. Instead, there are a number of smaller packages targetting different technologies and functions.
Initialisation
After adding our packages, we next need to configure our telemetry options using the application builder. OpenTelemetry is a granular framework and consists of a number of different features which can be switched on or off. We need to specify which telemetry signals we wish to capture as well as specifying where the telemetry should be sent.
In the code below you will notice that we create two different builders. On this line we create a WebApplicationBuilder instance:
var builder = WebApplication.CreateBuilder(args);
On these lines, we configure our logging options:
builder.Logging.AddOpenTelemetry(options =>
{
    options
        .SetResourceBuilder(
            ResourceBuilder.CreateDefault()
                .AddService(serviceName))
        .AddConsoleExporter();
});
Next we create a ResourceBuilder, which is then passed to the WebApplicationBuilder:
    Action<ResourceBuilder> appResourceBuilder =
    resource => resource
        .AddDetector(new ContainerResourceDetector())
        .AddService(serviceName);
When we create these builders we need to provide the name of our service. This is essential so that the source of the telemetry can be identified when viewing it in a tool such as Grafana.
Next we configure our options for tracing and metrics:
    builder.Services.AddOpenTelemetry()
      .ConfigureResource(appResourceBuilder)
      .WithTracing(tracing => tracing
          .AddAspNetCoreInstrumentation()
          .AddOtlpExporter(options =>
          {
              options.Endpoint = new Uri($"{oTelCollectorUrl}/v1/traces");
              options.Protocol=OpenTelemetry.Exporter.OtlpExportProtocol.Grpc;
          })		  )
      .WithMetrics(metrics => metrics
          .AddAspNetCoreInstrumentation()
           .AddOtlpExporter(options =>
           {
               options.Endpoint = new Uri(oTelCollectorUrl);
               options.Protocol = OpenTelemetry.Exporter.OtlpExportProtocol.Grpc;
           })
          .AddConsoleExporter());
This involves specifying the EndPoint and the Protocol. Grpc is the default protocol for OpenTelemetry, although you can also use Http. As you can see, once our application is deployed it will emit metric and trace signals to the OpenTelemetry Collector and will emit logs to the Console.
var builder = WebApplication.CreateBuilder(args);
const string serviceName = "relay-service";
string oTelCollectorUrl = builder.Configuration["AppSettings:oTelCollectorUrl"];
builder.Logging.AddOpenTelemetry(options =>
{
    options
        .SetResourceBuilder(
            ResourceBuilder.CreateDefault()
                .AddService(serviceName))
        .AddConsoleExporter();
});

Action<ResourceBuilder> appResourceBuilder =
    resource => resource
        .AddDetector(new ContainerResourceDetector())
        .AddService(serviceName);

builder.Services.AddOpenTelemetry()
      .ConfigureResource(appResourceBuilder)
      .WithTracing(tracing => tracing
          .AddAspNetCoreInstrumentation()
          .AddOtlpExporter(options =>
          {
              options.Endpoint = new Uri($"{oTelCollectorUrl}/v1/traces");
              options.Protocol=OpenTelemetry.Exporter.OtlpExportProtocol.Grpc;
          })		  )
      .WithMetrics(metrics => metrics
          .AddAspNetCoreInstrumentation()
           .AddOtlpExporter(options =>
           {
               options.Endpoint = new Uri(oTelCollectorUrl);
               options.Protocol = OpenTelemetry.Exporter.OtlpExportProtocol.Grpc;
           })
          .AddConsoleExporter());

var app = builder.Build();
OpenTelemetry Logging
The SDK, naturally, emits its own logging and you can use the OTEL_LOG_LEVEL environment variable to define the logging level. For ease of use we are just going to define this in the deployment YAML file for our web application:
    resources:
        limits:
        cpu: 250m
        memory: 256Mi
        requests:
        cpu: 100m
        memory: 128Mi
    env:
    - name: OTEL_LOG_LEVEL
        value: "debug"
In addition to this you can also obtain more verbose diagnostics by dropping an OTEL_DIAGNOSTICS.json file into the root directory of your executable.
The configuration for this file is very simple:
    {
    "LogDirectory": ".",
    "FileSize": 32768,
    "LogLevel": "Warning"
    }
Once the SDK detects the presence of this file it will start emitting detailed diagnostics to a log file whose name follows the pattern 'dotnet<random int>.log'. This can be a really useful aid to debugging but is obviously not advisable for production environments.
The OpenTelemetry Collector
We are going to be running the Collector in an Azure AKS cluster and, as per this document, we will install this as a daemonset so that it is available on each node
We are going to deploy the Collector using Helm, so the first thing we need to do is add the OpenTelemetry Helm charts to our repository:
helm repo add open-telemetry https://open-telemetry.github.io/opentelemetry-helm-charts
Next, we need to define our own custom values for the Collector.
We are enabling:
- kubernetesAttributes
- kubeletMetrics
- logs collection.
Our file will look like this:
mode: daemonset

presets:
 # enables the k8sattributesprocessor and adds it to the traces, metrics, and logs pipelines
  kubernetesAttributes:
    enabled: true
  # enables the kubeletstatsreceiver and adds it to the metrics pipelines
  kubeletMetrics:
    enabled: true
  # Enables the filelogreceiver and adds it to the logs pipelines
  logsCollection:
    enabled: true
## The chart only includes the loggingexporter by default
## If you want to send your data somewhere you need to
## configure an exporter, such as the otlpexporter
config:
  exporters:
    otlp:
      endpoint: "tempo-distributor.grafana-tempo.svc.cluster.local:4317"
      tls:
        insecure: true
  service:
    telemetry:
      logs:
        level: "debug"
    pipelines:
      traces:
        exporters: [ otlp ]
#     metrics:
#       exporters: [ otlp ]
#     logs:
#       exporters: [ otlp ]
service:
  # Enable the creation of a Service.
  # By default, it's enabled on mode != daemonset.
  # However, to enable it on mode = daemonset, its creation must be explicitly enabled
  enabled: true
  type: LoadBalancer
  loadBalancerIP: ""
  annotations:
    service.beta.kubernetes.io/azure-load-balancer-internal: "true"
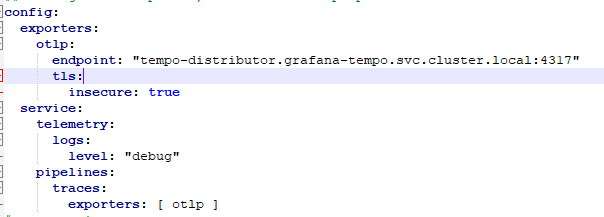
It might be worth just breaking this down a bit. On these lines we configure a traces exporter.
This will export trace telemetry to an instance of Grafana Tempo running on the same cluster:
      exporters:
    otlp:
      endpoint: "tempo-distributor.grafana-tempo.svc.cluster.local:4317"
      tls:
        insecure: true
On these lines we are configuring the Collector to emit logging about itself:
     service:
    telemetry:
      logs:
        level: "debug"
On these lines we are adding our otlp exporter to our pipeline:
        pipelines:
      traces:
        exporters: [ otlp ]
On these lines we are creating an Azure AKS Load Balancer Service, which will only be accessible inside the cluster:
       enabled: true
  type: LoadBalancer
  loadBalancerIP: ""
  annotations:
    service.beta.kubernetes.io/azure-load-balancer-internal: "true"
By default, Load Balancers have a public IP address assigned to them. We are overriding this by setting the Load Balancer IP to an empty string.
We are also adding an Azure AKS specific annotation to make the Load Balancer internal only.
Different cloud providers will have different ways of implementing this option.
We can now install the Collector into our cluster:
helm install otel-collector open-telemetry/opentelemetry-collector --values values.yml
KubeStats Service
When we installed the Collector using this configuration we found that the kubestats service receives this error trying to scrape metrics from the kubelet:
"otel-collector-opentelemetry-collector-agent-q97ql opentelemetry-collector 2023-12-09T14:31:16.104Z

error   scraperhelper/scrapercontroller.go:200  Error scraping metrics

{"kind": "receiver", "name": "kubeletstats", "data_type": "metrics", "error": "Get \"https://aks-nodepool1-16446667-vmss000006:10250/stats/summary\":

tls: failed to verify certificate: x509: certificate signed by unknown authority", "scraper": "kubeletstats"}"
We resolved this by updating the configmap for the Kubestats service by setting the insecure_skip_verify option to true
    kubeletstats:
    auth_type: serviceAccount
    collection_interval: 20s
    endpoint: ${env:K8S_NODE_NAME}:10250
    insecure_skip_verify: true
This obviously may not be desirable for production environments
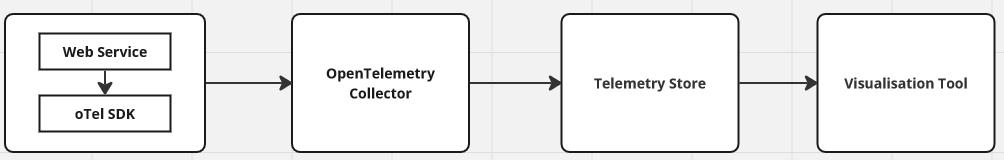
We have our OpenTelemetry Collector up and running. It is receiving and exporting logs, metrics and traces. Although the Collector is a highly sophisticated service, it is important to remember that it is, essentially, a relay. It has no UI and it does not store telemetry. It collects and forwards telemetry signals. The storage and visualisation of those signals are functions performed by tools further downstream in the overall telemetry pipeline. We will now look at the processing of trace signals in Grafana Tempo.
Traces - Grafana Tempo
If you wish, you can use the Cloud version of Tempo - and this means that you can avoid the overhead of installing and maintaining your own instance. We like to get hands on, so we are going to install our own instance in our AKS cluster. The self-hosted version of Tempo can be deployed in two modes - either as a monolith or as a set of microservices. We are going to use the distributed/microservices option. In functional terms, they are largely the same. The distributed version, however, splits the monolith into a number of smaller services which can then each be scaled independently.
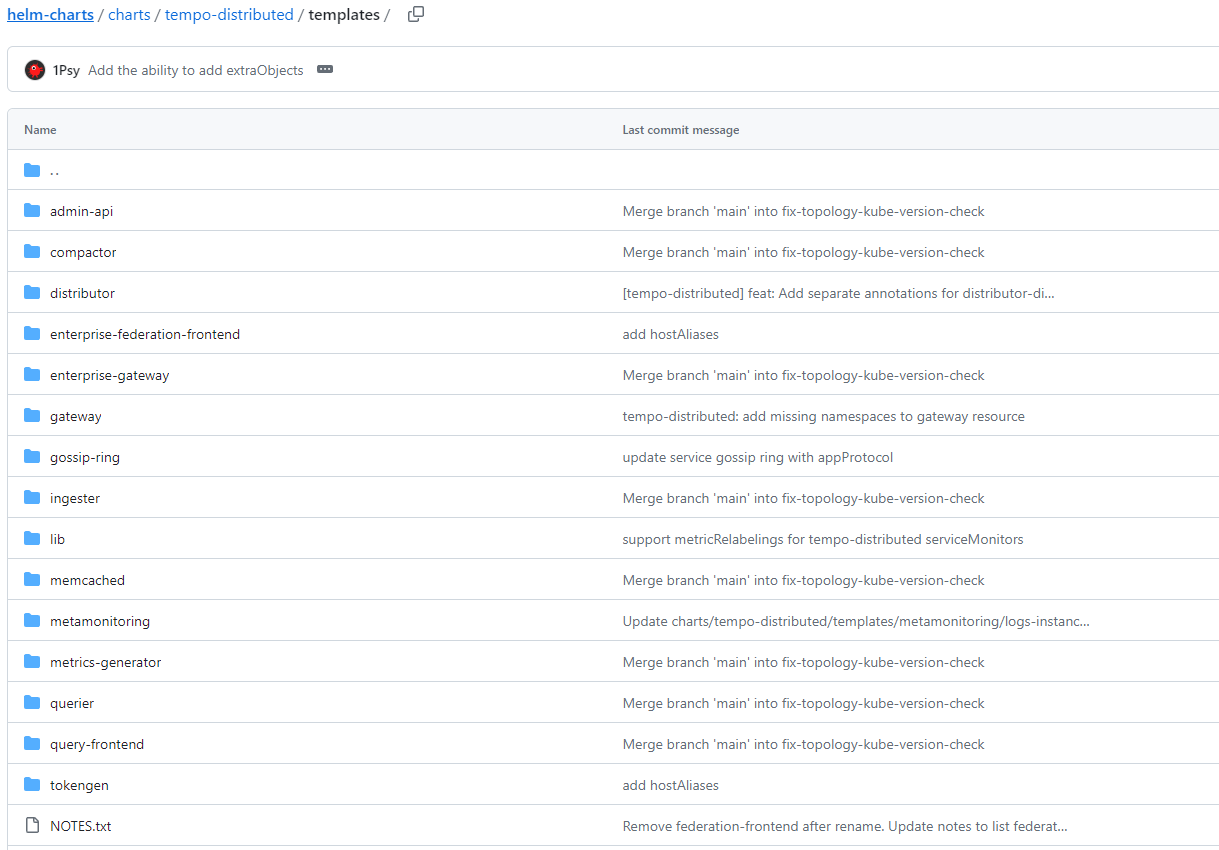
A quick glance at the GitHub repo for the Helm charts for Tempo shows that it is not a trivial application and consists of multiple components:
Click on image to enlarge
Hardware Requirements
Tempo requires a node with a minimum of four cores and 16GB of RAM (https://grafana.com/docs/helm-charts/tempo-distributed/next/get-started-helm-charts/)
Set Up
In setting up our Tempo instance we will be (roughly) following the instructions on this page from the Grafana Tempo docs.
The first thing we will do is create a new namespace in our cluster:
kubectl create namespace grafana-tempo
Next we will add the Grafana Helm charts to our local Helm repo:
helm repo add grafana https://grafana.github.io/helm-charts
helm repo update
The documentation provides the following sample values for our values.yaml file:
---
storage:
  trace:
    backend: s3
    s3:
      access_key: 'grafana-tempo'
      secret_key: 'supersecret'
      bucket: 'tempo-traces'
      endpoint: 'tempo-minio:9000'
      insecure: true
#MinIO storage configuration
minio:
  enabled: true
  mode: standalone
  rootUser: grafana-tempo
  rootPassword: supersecret
  buckets:
    # Default Tempo storage bucket
    - name: tempo-traces
      policy: none
      purge: false
traces:
  otlp:
    grpc:
      enabled: true
    http:
      enabled: true
  zipkin:
    enabled: false
  jaeger:
    thriftHttp:
      enabled: false
  opencensus:
    enabled: false
Storage
Rather than using MiniIo or Amazon S3 we will be using an Azure Storage Account, so our configuration will look like this:
storage:
  trace:
    backend: azure
    azure:
      container_name: tempo-traces
      storage_account_name: stgappgeneraluks
      storage_account_key: ${STORAGE_ACCOUNT_ACCESS_KEY}

distributor:
  log_received_spans:
    enabled: true
  extraArgs:
  - "-config.expand-env=true"
  extraEnv:
  - name: STORAGE_ACCOUNT_ACCESS_KEY
    valueFrom:
      secretKeyRef:
        name: tempo-traces-stg-key
        key: tempo-traces-key

compactor:
  extraArgs:
  - "-config.expand-env=true"
  extraEnv:
  - name: STORAGE_ACCOUNT_ACCESS_KEY
    valueFrom:
      secretKeyRef:
        name: tempo-traces-stg-key
        key: tempo-traces-key

ingester:
  extraArgs:
  - "-config.expand-env=true"
  extraEnv:
  - name: STORAGE_ACCOUNT_ACCESS_KEY
    valueFrom:
      secretKeyRef:
        name: tempo-traces-stg-key
        key: tempo-traces-key

querier:
  extraArgs:
  - "-config.expand-env=true"
  extraEnv:
  - name: STORAGE_ACCOUNT_ACCESS_KEY
    valueFrom:
      secretKeyRef:
        name: tempo-traces-stg-key
        key: tempo-traces-key

queryFrontend:
  extraArgs:
  - "-config.expand-env=true"
  extraEnv:
  - name: STORAGE_ACCOUNT_ACCESS_KEY
    valueFrom:
      secretKeyRef:
        name: tempo-traces-stg-key
        key: tempo-traces-key
As we are running in distributed mode, we need to configure the extra arguments for each of the services that will be connecting to our storage account. This means that we have to apply the configuration to the following services:
- distributor
- compactor
- ingester
- querier
- query-frontend
Clearly we don't want to expose the value for our Azure Storage Account key in our Helm chart. We are therefore pointing to a secret which contains the value. Obviously this means that we will need to create a secret which has the value for our storage account key. We will need to create this in the same namespace as our tempo instance:
kubectl create secret generic tempo-traces-stg-key --from-literal=tempo-traces-key=<your-key> -n grafana-tempo
We are only collecting oltp traces, so in our configuration we have defined values for oltp but set Zipkin, Jaeger and OpenCensus to false.
Installation
We are now ready to install our Temp Helm chart:
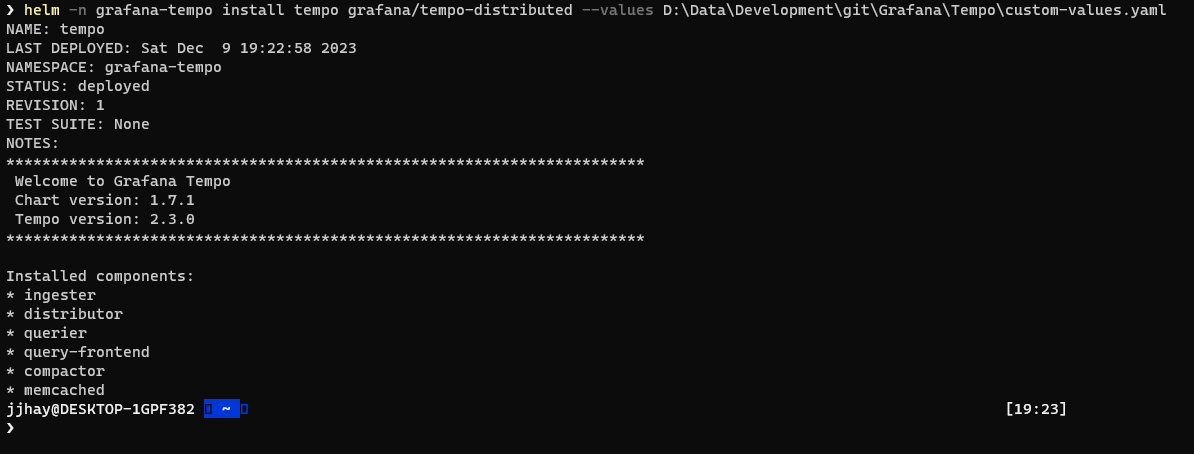
helm -n grafana-tempo install tempo grafana/tempo-distributed --values D:\Data\Development\git\Grafana\Tempo\custom-values.yaml
If the command completes successfully you will see a summary of the components that have been installed:
Click on image to enlarge
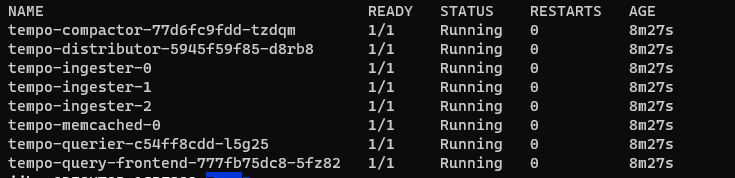
The next thing to do is verify that the pods are running successfully:
kubectl -n grafana-tempo get pods
You should see something like this:
Click on image to enlarge
Before looking at our trace data, let us just quickly recap our basic pipeline configuration.
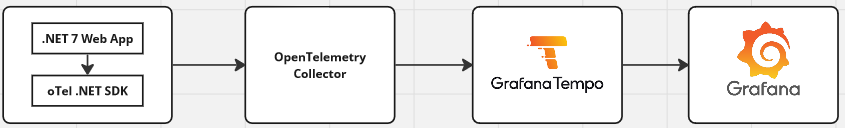
Our application is configured to emit telemetry to the OpenTelemetry collector, and sends traces to http://otel-collector-opentelemetry-collector:4317.
The Collector is configured to export to the local Tempo Distributor service. This is the configuration in our daemonset-values.yaml file:
Click on image to enlarge
Click on image to enlarge
Viewing Traces in Grafana
Tempo is essentially a store - if we want to see our traces we will need to use a visualisation tool such as Grafana. We are going to be following the instructions on
this page:
to run a quick and easy installation of Grafana onto our cluster. We are going to call our namespace 'grafana-main' rather than 'my-grafana' as used in the documentation.
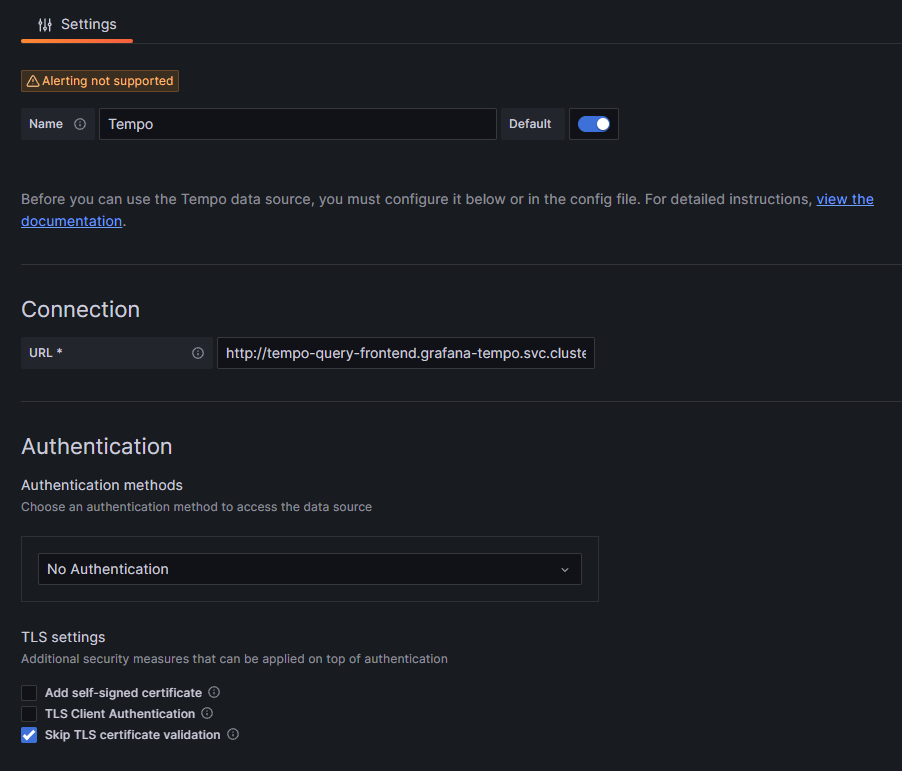
Once Grafana is running on our cluster, we will set up a new connection to point to our Tempo instance:
Click on image to enlarge
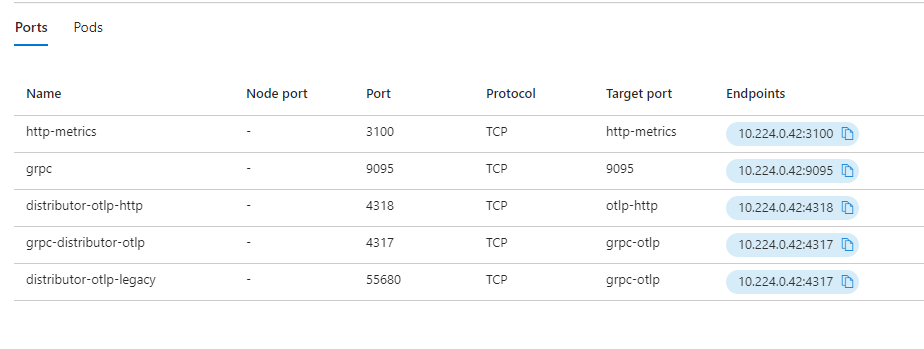
The connection Url we are using is http://tempo-query-frontend.grafana-tempo.svc.cluster.local:3100
if you are running Tempo in microservices mode, tempo-query-frontend is the name of the service to connect to when creating a new connection in Grafana. In our case, this service is running on port 3100 - although that may not always be the case.
We need to append this segment: 'grafana-tempo.svc.cluster.local' to the name of our service because Tempo is running in a separate namespace to Grafana.
Now we can click on Save and Test and open up the Explorer
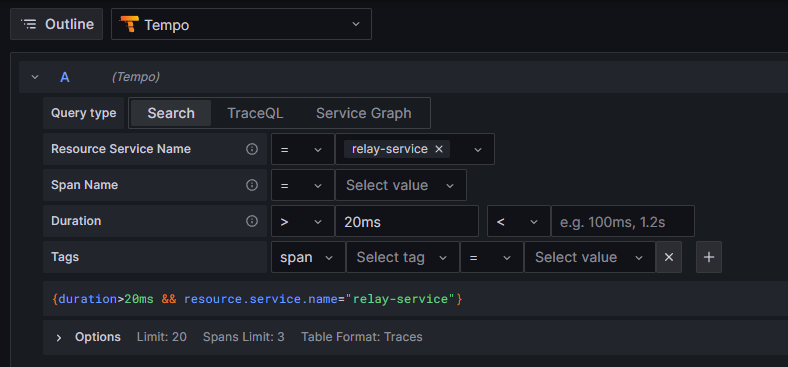
We are going to run a very simple query to retrieve any traces with a length greater than 20ms. We are going to filter by Service Name (this is the name that we specified for our service in our program.cs file).
Click on image to enlarge
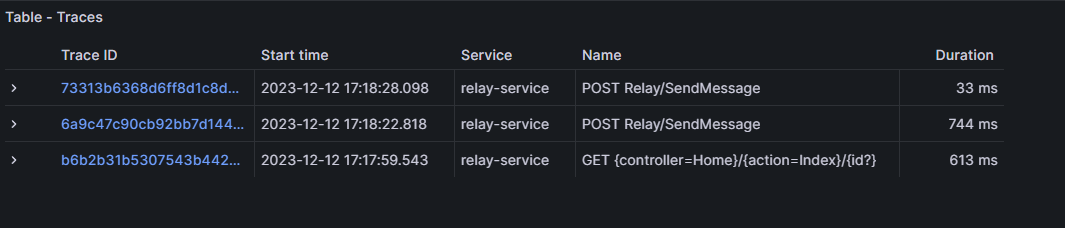
If we click on the Run Query button we will see a table with traces that meet our criteria:
Click on image to enlarge
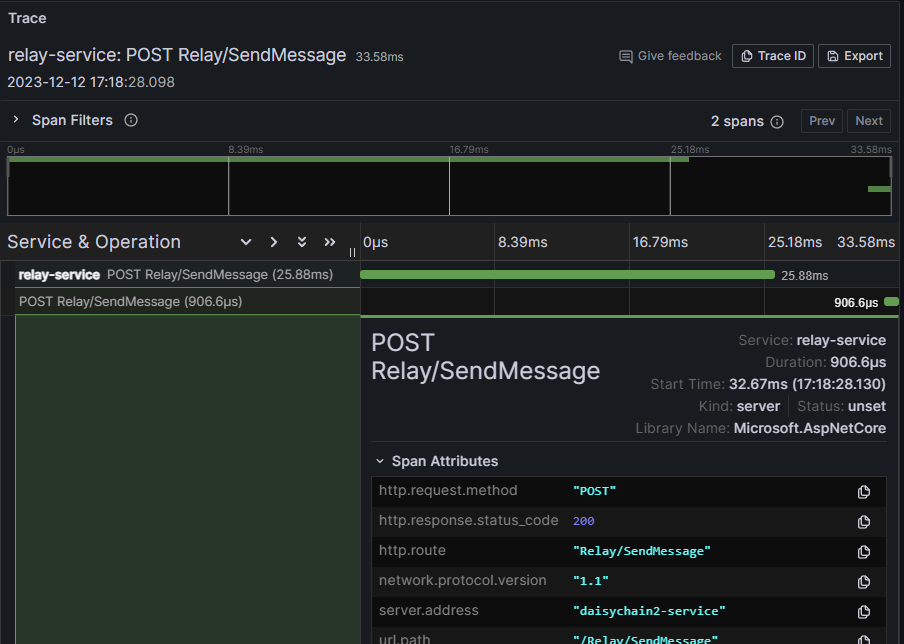
We can then start to drill down and see some rich telemetry on our http requests:
Click on image to enlarge
That's it - we now have an end to end pipeline for emitting, collecting, storing and viewing our traces!
Collector Telemetry
As you would probably expect, you can also configure how the Collector actually emits telemetry about itself.
This is managed in the service/telemetry section of the YAML definition of the collector:
service:
  telemetry:
    logs:
      level: DEBUG
      initial_fields:
        service: my-instance
    metrics:
      level: detailed
      address: 0.0.0.0:8888
You can find more information on this topic here. You can configure logs and metrics for the service but not profiling or traces.
Note that it’s possible to scrape the metrics by using a Prometheus receiver within the Collector configuration so that we can consume the Collector’s metrics at the backend. For example:
receivers:
  prometheus:
    trim_metric_suffixes: true
    use_start_time_metric: true
    start_time_metric_regex: .*
    config:
      scrape_configs:
        - job_name: 'otel-collector'
          scrape_interval: 5s
          static_configs:
            - targets: ['127.0.0.1:8888']

exporters:
  otlp:
    endpoint: my.company.com:4317
    tls:
      insecure: true

service:
  pipelines:
    metrics:
      receivers: [prometheus]
      exporters: [otlp]
The OpenTelemetry documentation suggests that some of the key service health indicators to monitor are:
- the rate of accepted vs. refused data (the health of your receivers)
- the rate of sent vs failed exports (the health of your exporters)
- queue length
- retry count
Final Thoughts
We have done quite a lot of work so far but at present we still only have a minimal set up. In our source code we are not defining any custom metrics. Equally, in our Collector we have not defined any sampling or filters. We also do not have endpoints for collecting logging or metrics. Each of these will require adding further layers of configuration to our Collector as well as provisioning further resources to our AKS cluster.
Even when we have configured all of our signals and set up all of our endpoints there are still further issues to consider. There are many different patterns just for deploying the Collector. It can be run as a deployment or as a DaemonSet and can also be created as an Operator. We can configure dedicated Collectors for each instance type on run them on different clusters. We can even compile custom versions of the Collector to package only the functionality we need and therefore reduce its footprint. As we mentioned at the beginning, oTel is a huge framework. Mastering it takes time and managing it is an ongoing process.