
SigNoz - 16,000 Stars and Rising...
Standing Out From The Crowd
Whilst the OpenTelemetry landscape is dominated by big names such as Splunk, Dynatrace and Datadog, there is a new generation of start-ups and full-stack observability vendors snapping at their heels.
One of the foremost among this new generation is SigNoz, a company that formed in 2019 with the aim of providing a full stack open source product with a positive developer experience. This recipe has proved successful and SigNoz has developed a strong following - with nearly ten million docker downloads as well as over 16,000 stars on their GitHub repo. The release of their cloud offering was also an important milestone in the company's development.
The middle tier observability space is becoming increasingly crowded, and it is becoming increasingly important for vendors to create an identity. This is an area where SigNoz excels - with their highly distinctive branding as well as an active presence across social media. They also blog prolifically and produce highly quality articles - especially around OpenTelemetry. They also have a certain swagger and confidently pitch themselves as an alternative to the major players - with particular emphasis on the dramatic cost savings they can offer.
The SigNoz offering is a full-stack open source product, with paid tiers offering additional features and support. The paid tiers focus mostly on the SigNoz cloud product, but they do also offer a paid-for plan for the self-hosted option. In this two-part article we will look at the self-hosted option and will cover:
Part 1
- installing SigNoz on an AKS cluster
- ingesting telemetry
- installing HotTROD and Locust
- analysing logs, metrics, and traces.
Part 2
- dashboards
- alerts
- exploring the ClickHouse backend
- product pricing
- conclusion
We will be working on a Windows 10 client machine and installing SigNoz into an Azure AKS cluster running Kubernetes version 1.27.7.
Installation
The documentation on the SigNoz will tend to usher you in the direction of signing up for their cloud-based solution - which offers a free one month trial. We are going to start off by running our own self-managed instance in an Azure AKS cluster.
The SigNoz web site includes guidance and scripts for installing SigNoz as a set of Docker containers running on Linux or MacOs. If you are interested in running the system on Kubernetes, you will need to head over to the SigNoz GitHub repo, where you will find instructions for installing the system via Helm.
First of all we will add the SigNoz Helm repo:
    helm repo add signoz https://charts.signoz.io

     helm repo update
Next we will create a namespace for SigNoz in our AKS cluster:
kubectl create ns signoz
And now we will install SigNoz:
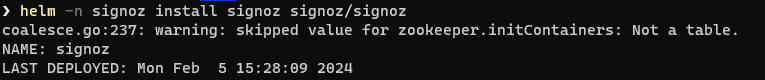
helm -n signoz install signoz signoz/signoz
There's a lot of SigNoz in that line of code :-)
Once the command has completed you may see a warning like the one below - but don't worry - it is nothing serious:
The first thing we will do is take a look at the pods that have been created:
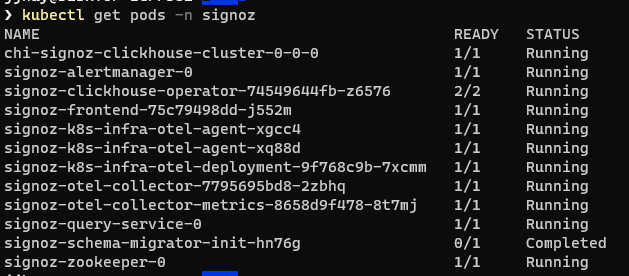
This already gives us a bit of in insight into the high-level architecture of the system. We can see that there is a front end, a query service, a ClickHouse backend and an Alert Manager. There is also an instance of Apache ZooKeeper for coordinating and tracking status across nodes.
We can see that the Helm chart has set up two OpenTelemetry collectors - one collector is dedicated to metrics, the other handles logs and traces.
There are two instances of the infra-otel-agent - this is because the agent runs as a daemonset and we have two nodes in our cluster
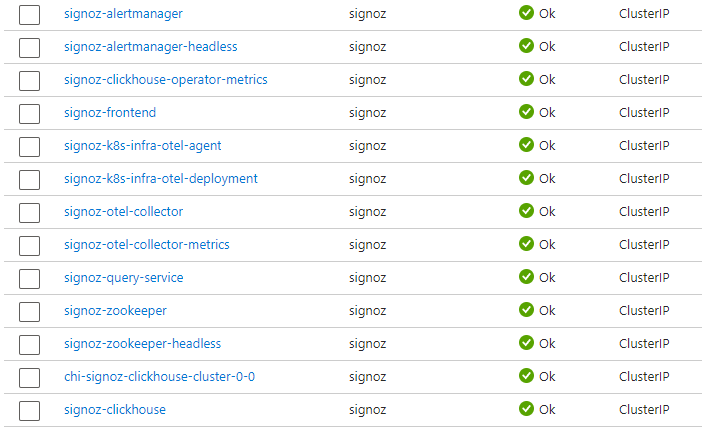
As well as the pods and daemonsets, the install will also create quite a number of services:
At this point, we have all of our SigNoz resources up and running as well as OpenTelemetry collectors and agents. What we don't have is an application to feed telemetry into our pipelines. To get up and running, the SigNoz documentation provides a script for installing the Jaeger HotROD application. This is a sample app developed by Uber to showcase OpenTelemetry tracing logic.
There is a script for installing HotRod using bash and curl but it will not work on a Windows client. We are therefore going to follow this procedure:
First create a namespace:
kubectl create namespace sample-application
Next download this Yaml template:
https://github.com/SigNoz/signoz/raw/develop/sample-apps/hotrod/hotrod-template.yaml
This template has a number of placeholders, which we need to replace with our own values:
        spec:
      containers:
        - args:
            - all
          env:
            - name: JAEGER_ENDPOINT
              value: "http://signoz-otel-collector.signoz.svc.cluster.local:14268/api/traces"
You can see the full Yaml for this chart in Appendix 1. It would be helpful if SigNoz could provide a Windows-compatible script rather than requiring Windows users to handcraft their own install script for HotROD.
Having populated the placeholders we then ran:
kubectl apply -n sample-application -f hotrod-template.yaml
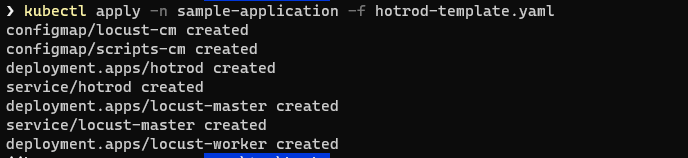
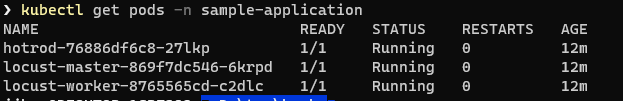
You will see that the following pods have been created:
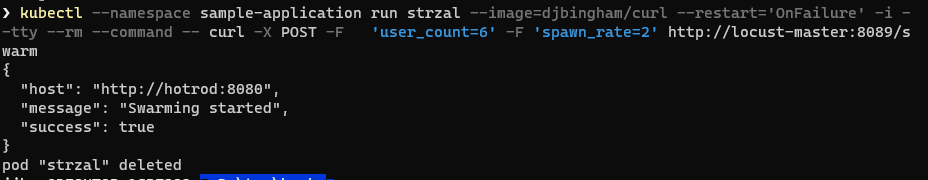
Finally, we will launch the sample application:
kubectl --namespace sample-application run strzal --image=djbingham/curl \ --restart='OnFailure' -i --tty --rm --command -- curl -X POST -F \ 'user_count=6' -F 'spawn_rate=2' http://locust-master:8089/swarm
You should receive a confirmation that swarming has started:
The HotROD demo application is a ride-sharing (Ride On Demand) app. It creates a service called hotrod, which runs on port 8080. Let's set up port-forwarding:
kubectl -n sample-application port-forward svc/hotrod 8080:8080
and then point our browser at http://localhost:8080
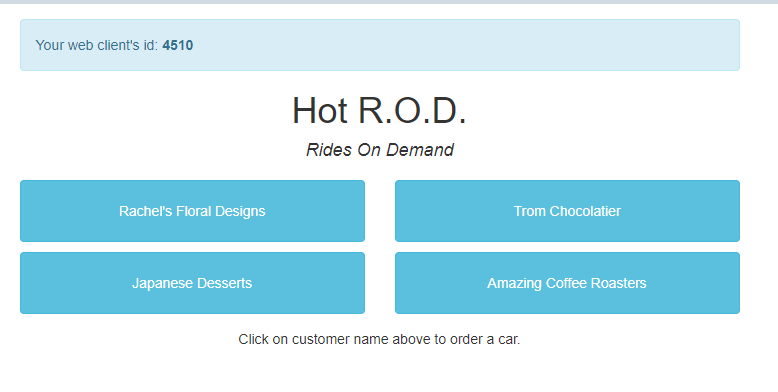
Clicking on a customer will order a car - which will kick off a trace. You can use this screen to generate traces manually if you don't want to run the Locust loader.
Traces
Having installed SigNoz and got the sample application running, the next thing we want to do is see our telemetry. The first thing we need to do is set up port-forwarding to the SigNoz service;
kubectl -n signoz port-forward svc/signoz-frontend 3301:3301
Next, we just need to navigate to http://localhost:3301 in our browser.
The first time you access the application you will be prompted to set up an admin account:
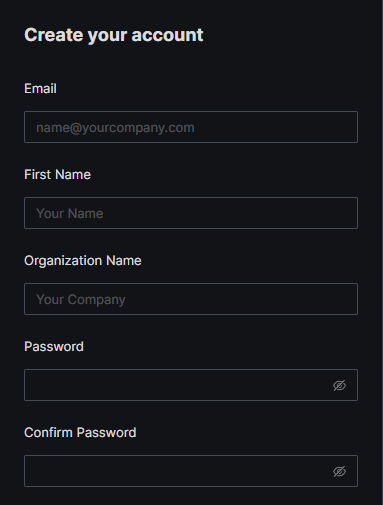
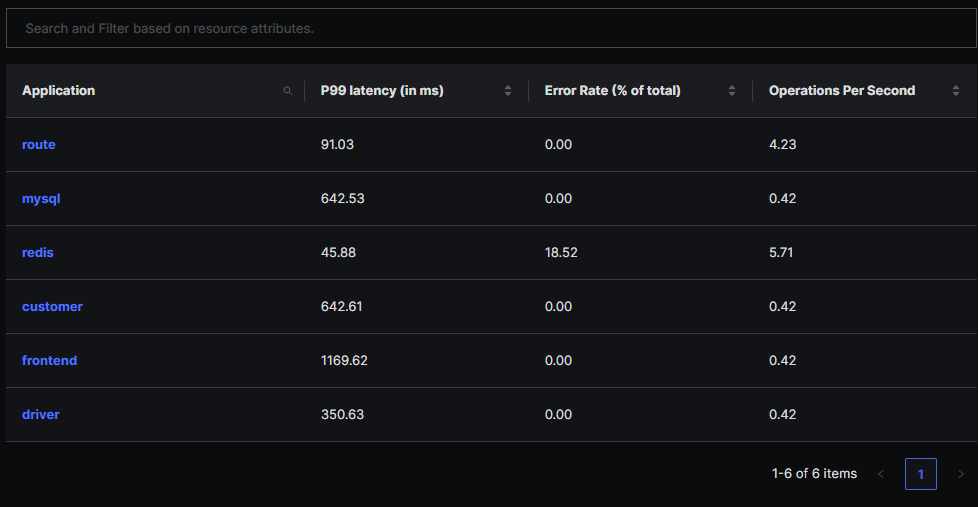
Once we enter the account details we can start using the system. The first thing we will see is the Services screen. From the HotROD documentation, we can see that the application consists of a number of services:
Below, we can see that each of these have been detected by SigNoz. A Service in SigNoz maps to a service.name value configured in your telemetry. The screen provides a summary of the RED (Rate, Errors, Duration) metrics for each service.
From here, we can drill down and view metrics for an individual service, with visualisations for key percentiles (p99, p90, p50):
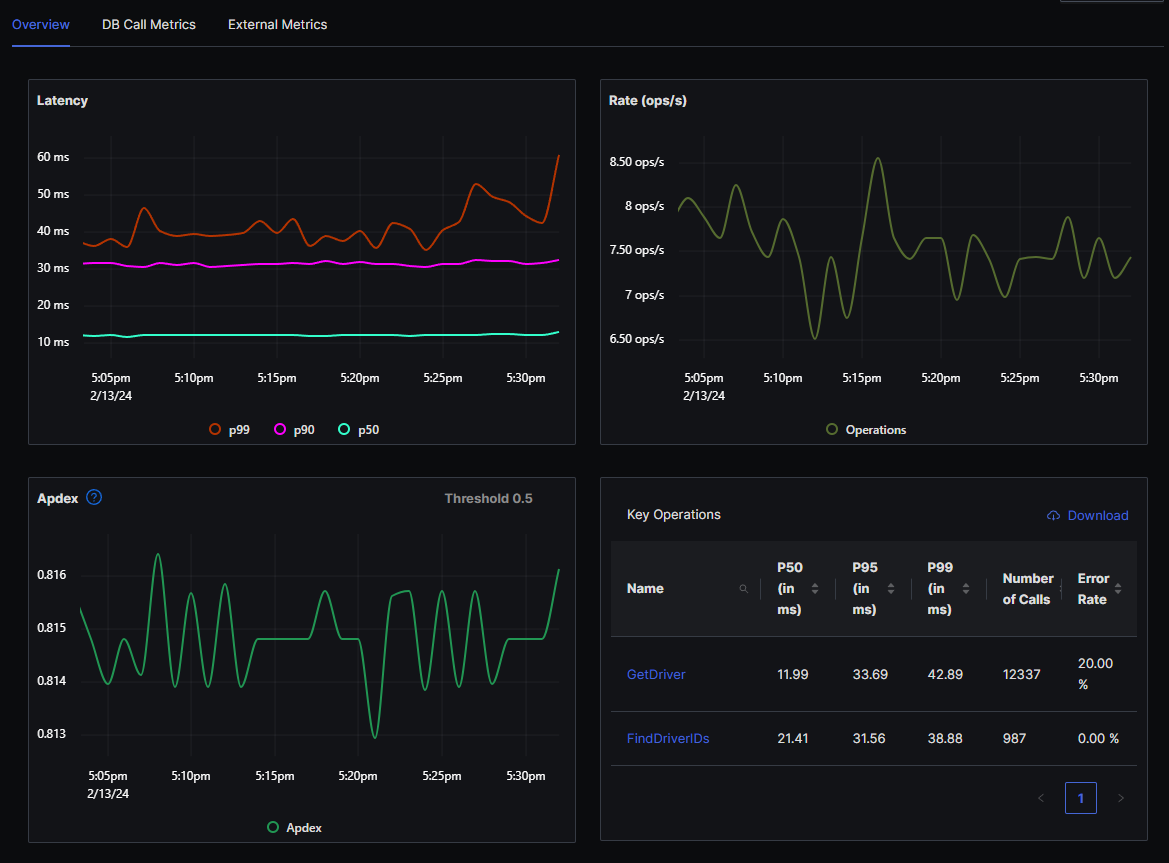
From the above screen, we can see that the 18.52% error rate for the Redis service in the Services screen is resulting from a 20% error rate in calls to the GetDriver operation.
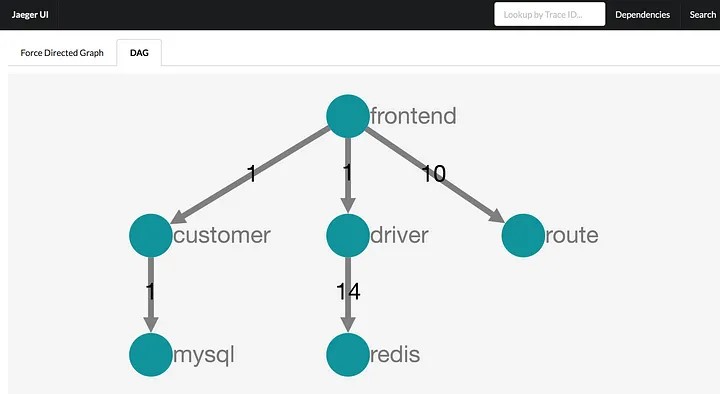
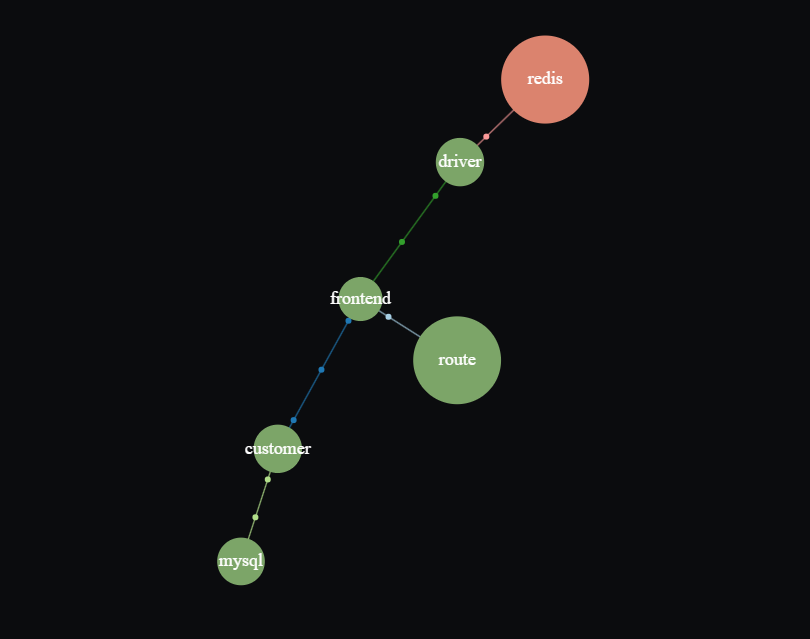
There is also a Service Map, which shows you the relationships between your services as well as a visualisation of latency and error rates. This can be useful for a quick, high level diagnostic view of your services.
Traces
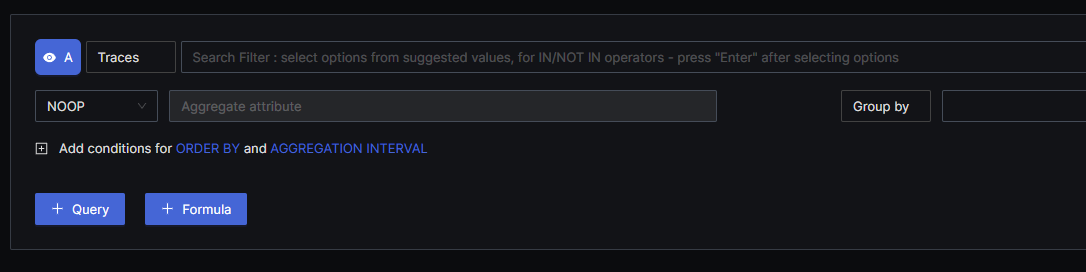
For viewing traces there is a classic view as well as a new Traces Explorer. Let us have a look at the Traces Explorer View:
This screen contains a Query Builder:
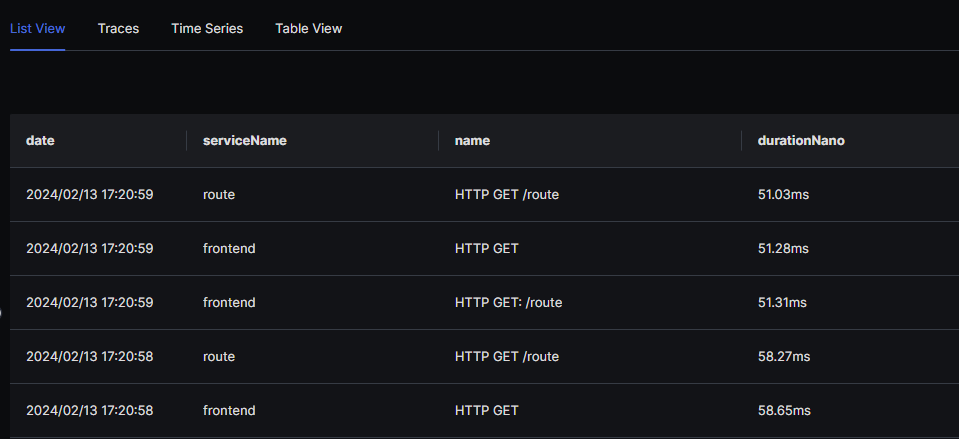
As well as list and table views of our traces
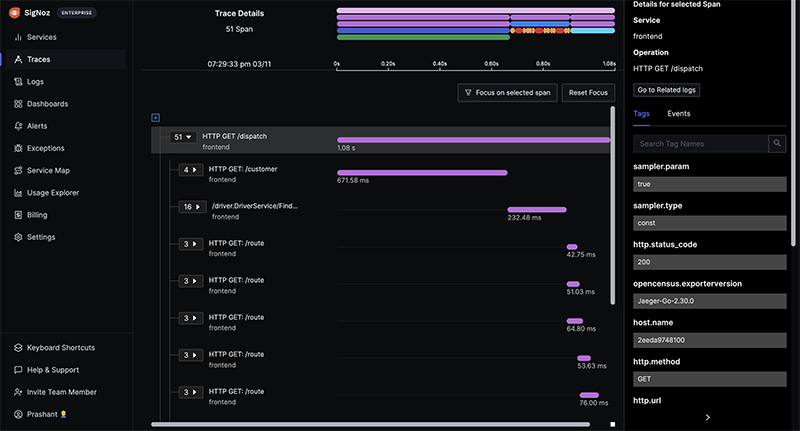
As you would expect, drilling down into a trace will give us a timeline of each of the spans:
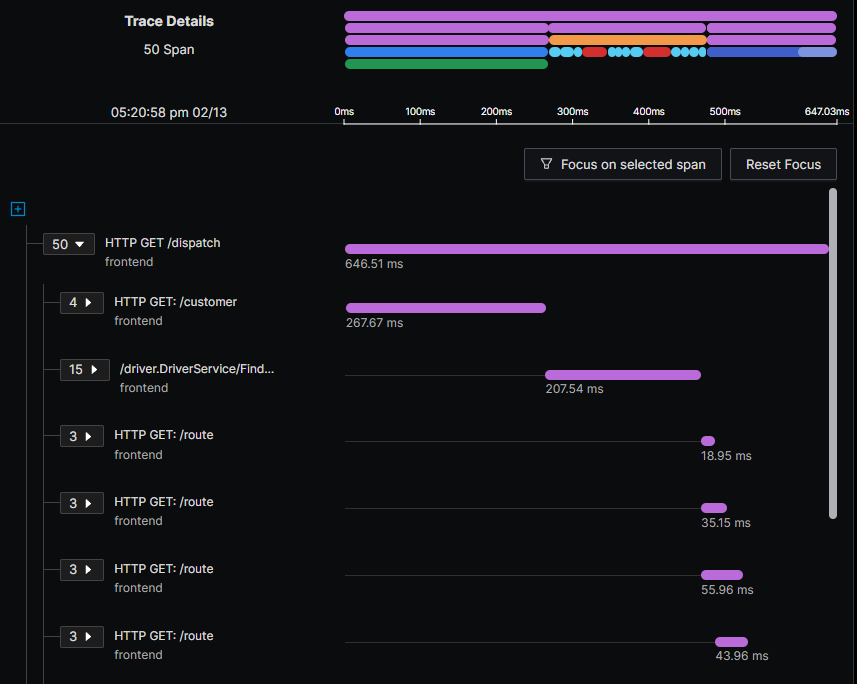
Clicking on any of the bars in the flame graph at the top of the page will take us to the details for an individual span:
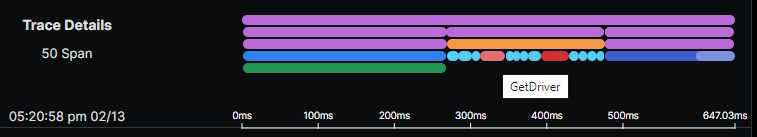
We can see that the Get Driver span was coloured red because of a Redis timeout:
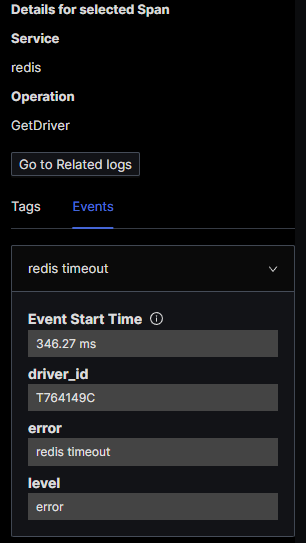
Log Trace Correlation
SigNoz also supports Trace/Log correlation. In the image above, you can see that if you select a particular span, you will see a Go to Related Logs button. The only proviso here is that your trace ids and span ids must be injected into your logs. If you are using an OpenTelemetry compliant SDK then this should occur transparently. This point is illustrated in the screenshot below. This is not a SigNoz screenshot, it is just the console output of a sample application that we have instrumented using OpenTelemetry .NET SDK. As you can see, TraceId's and SpanId's are automatically injected into log entries:
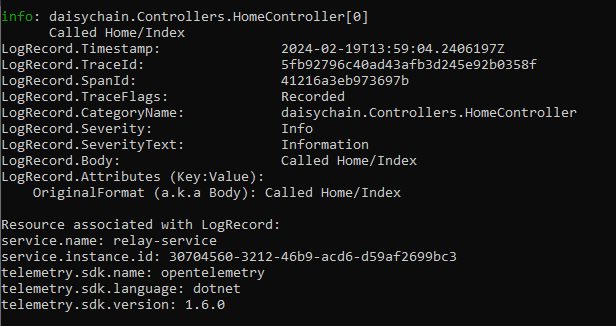
This is one of the advantages that SigNoz derives from its native support for OpenTelemetry.
Logging
SigNoz has a number of different channels for ingesting logs:
- Application logs - these are ingested via an OpenTelemetry collector
- VM/Infrastructure logs - these are gathered by an OpenTelemetry binary. At the moment it seems there is only support for Mac or Linux systems
- Kubernetes logs - SigNoz will automatically ingest logs from the local K8S instance. The scope for this can be defined in the
valuesfile for the Helm chart.
Logs are saved into the Clickhouse database that is spun up as part of the Helm installation. The advantage of this is that you can connect to the Clickhouse database cluster and run your own queries SQL queries - which will really appeal to users wanting to really dig into their logging data.
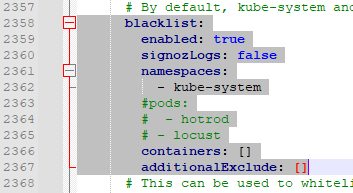
To generate some application logs we edited the Helm values chart to remove HotROD from the blacklist:
We then ran a Helm upgrade, supplying the path for our updated Helm values file:
helm -n signoz upgrade signoz signoz/signoz -f values.yaml
and then kicked off our Locust swarm again:
kubectl --namespace sample-application run strzal --image=djbingham/curl --restart='OnFailure' -i --tty --rm --command -- curl -X POST -F 'user_count=6' -F 'spawn_rate=2' http://locust-master:8089/swarm
Querying Logs
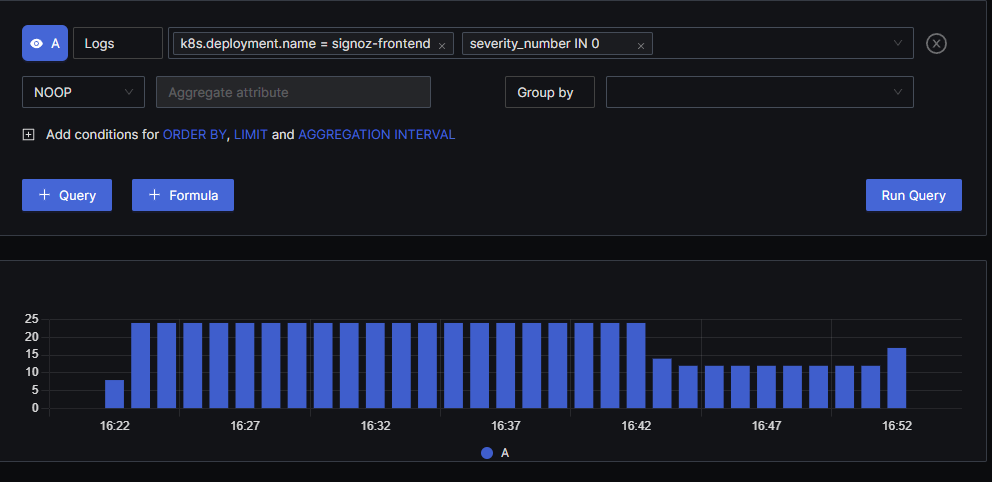
Querying logs is very simple in SigNoz, with a very clean and straightforward UI. When you click into the search box you will see a drop-down-list of popular search labels such as k8s.deployment.name - although you can obviously enter any valid label name.
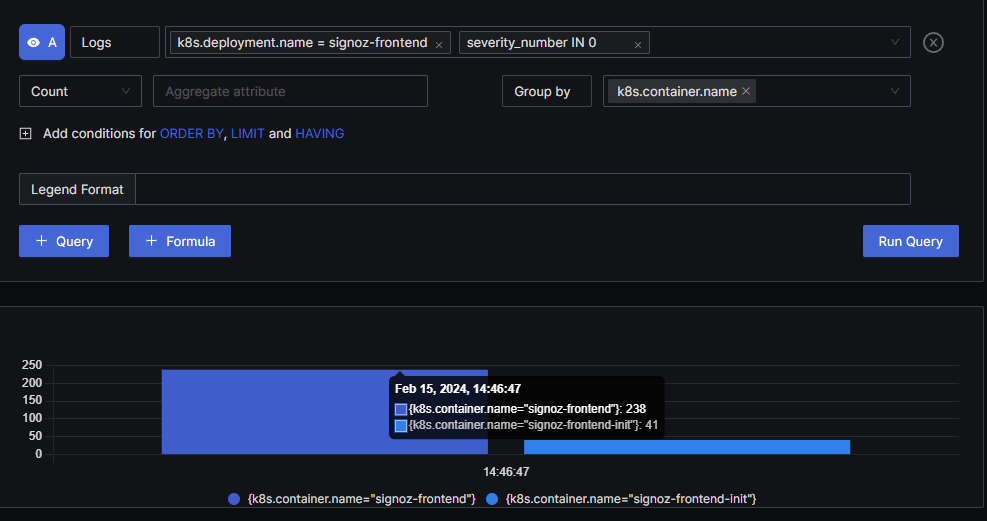
Output from running the query:
As well as the chart view above, the query will also return a list view with the log details:
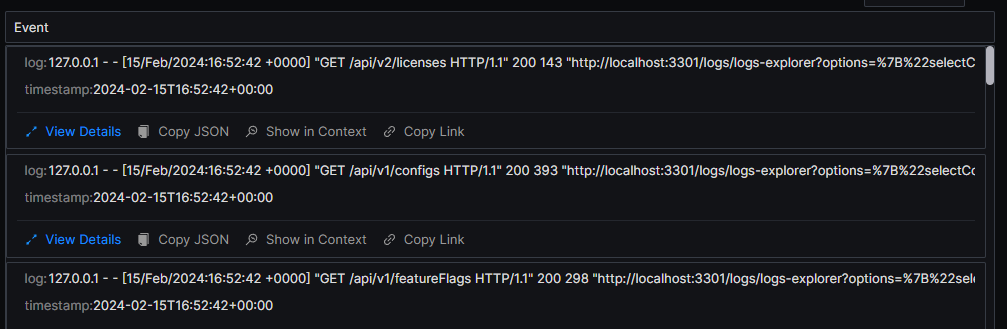
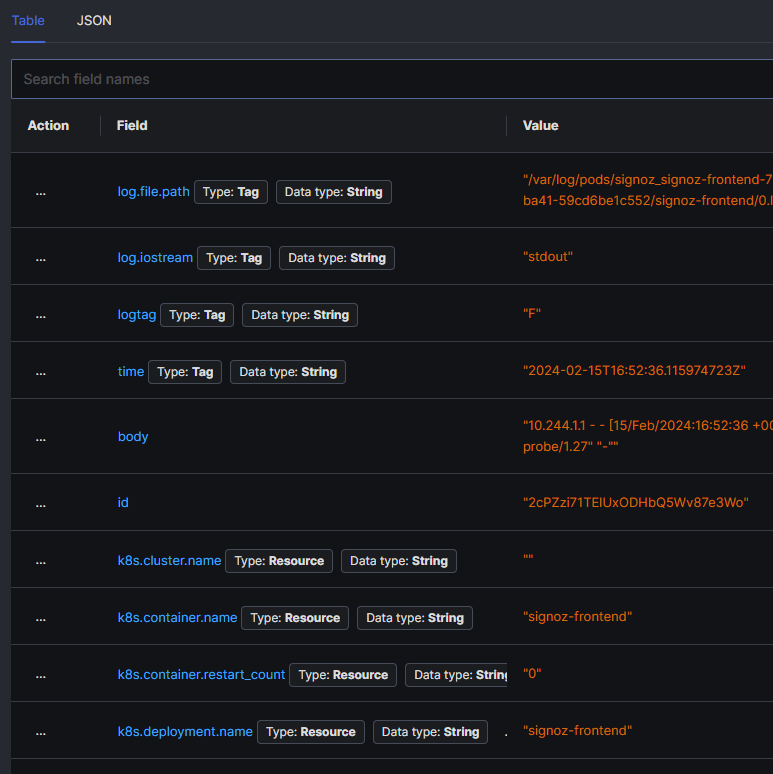
You can also click on any entry in the list and see a detailed view of the log entry.
Conclusion
This concludes the first part of our SigNoz review. In this part we have taken a brief overview of the company, looked at setting up a self-hosted instance running on Kuberetes and also looked at how the application manages the three main telemetry signals. Next, we will look at some additional features, delve into the data and give our overall opinion.
Appendix
Full text for the HotROD Helm chart
                        apiVersion: v1


kind: ConfigMap
metadata:
  name: locust-cm
data:
  ATTACKED_HOST: http://hotrod:8080
---
apiVersion: v1
kind: ConfigMap
metadata:
  name: scripts-cm
data:
  locustfile.py: |
    from locust import HttpUser, task, between
    class UserTasks(HttpUser):
        wait_time = between(5, 15)

                                @task
        def rachel(self):
            self.client.get("/dispatch?customer=123&nonse=0.6308392664170006")
                                @task
        def trom(self):
            self.client.get("/dispatch?customer=392&nonse=0.015296363321630757")
                                @task
        def japanese(self):
            self.client.get("/dispatch?customer=731&nonse=0.8022286220408668")
                                @task
        def coffee(self):
            self.client.get("/dispatch?customer=567&nonse=0.0022220379420636593")
---
apiVersion: apps/v1
kind: Deployment
metadata:
  labels:
    service: hotrod
  name: hotrod
spec:
  replicas: 1
  selector:
    matchLabels:
      service: hotrod
  strategy: {}
  template:
    metadata:
      labels:
        service: hotrod
    spec:
      containers:
        - args:
            - all
          env:
            - name: JAEGER_ENDPOINT
              value: "http://signoz-otel-collector.signoz.svc.cluster.local:14268/api/traces"
          image: "jaegertracing/example-hotrod:1.30"
          imagePullPolicy: IfNotPresent
          name: hotrod
          ports:
            - containerPort: 8080
      restartPolicy: Always
---
apiVersion: v1
kind: Service
metadata:
  labels:
    service: hotrod
  name: hotrod
spec:
  ports:
  - name: "8080"
    port: 8080
    targetPort: 8080
  selector:
    service: hotrod
---
apiVersion: apps/v1
kind: Deployment
metadata:
  annotations:
    deployment.kubernetes.io/revision: "1"
  labels:
    role: locust-master
  name: locust-master
spec:
  replicas: 1
  selector:
    matchLabels:
      role: locust-master
  strategy:
    rollingUpdate:
      maxSurge: 1
      maxUnavailable: 1
    type: RollingUpdate
  template:
    metadata:
      labels:
        role: locust-master
    spec:
      containers:
      - image: "signoz/locust:1.2.3"
        imagePullPolicy: IfNotPresent
        name: locust-master
        env:
          - name: ATTACKED_HOST
            valueFrom:
              configMapKeyRef:
                name: locust-cm
                key: ATTACKED_HOST
          - name: LOCUST_MODE
            value: MASTER
          - name: LOCUST_OPTS
            value: --print-stats
        volumeMounts:
          - mountPath: /locust
            name: locust-scripts
        ports:
        - containerPort: 5557
          name: comm
        - containerPort: 5558
          name: comm-plus-1
        - containerPort: 8089
          name: web-ui
        terminationMessagePath: /dev/termination-log
        terminationMessagePolicy: File
      dnsPolicy: ClusterFirst
      restartPolicy: Always
      schedulerName: default-scheduler
      securityContext: {}
      terminationGracePeriodSeconds: 30
      volumes:
      - name: locust-scripts
        configMap:
          name: scripts-cm
---
apiVersion: v1
kind: Service
metadata:
  labels:
    role: locust-master
  name: locust-master
spec:
  ports:
  - port: 5557
    name: communication
  - port: 5558
    name: communication-plus-1
  - port: 8089
    targetPort: 8089
    name: web-ui
  selector:
    role: locust-master
---
apiVersion: apps/v1
kind: Deployment
metadata:
  annotations:
    deployment.kubernetes.io/revision: "1"
  labels:
    role: locust-worker
  name: locust-worker
spec:
  replicas: 1
  selector:
    matchLabels:
      role: locust-worker
  strategy:
    rollingUpdate:
      maxSurge: 1
      maxUnavailable: 1
    type: RollingUpdate
  template:
    metadata:
      labels:
        role: locust-worker
    spec:
      containers:
      - image: "signoz/locust:1.2.3"
        imagePullPolicy: IfNotPresent
        name: locust-worker
        env:
          - name: ATTACKED_HOST
            valueFrom:
              configMapKeyRef:
                name: locust-cm
                key: ATTACKED_HOST
          - name: LOCUST_MODE
            value: WORKER
          - name: LOCUST_MASTER_HOST
            value: locust-master
        volumeMounts:
          - mountPath: /locust
            name: locust-scripts
        terminationMessagePath: /dev/termination-log
        terminationMessagePolicy: File
      dnsPolicy: ClusterFirst
      restartPolicy: Always
      schedulerName: default-scheduler
      securityContext: {}
      terminationGracePeriodSeconds: 30
      volumes:
      - name: locust-scripts
        configMap:
          name: scripts-cm