As we know, observability systems ingest vast amounts of metrics data. As we also know, this can potentially involve considerable cost. At present, metrics are capable of providing us with rich analytics into the current and past performance of our systems. What is missing from the picture at the moment seems to be the ability to use the vast amounts of metrics we harvest for predictive analytics. The spectacular feats accomplished by LLM's have led to heightened expectations that AI/ML can make forecasts that can be reliably used to predict and prevent outages and potential error conditions.
Unfortunately, the techniques employed by LLM's to construct apparently meaningful textual content do not translate to predicting future patterns in time series data. Whilst detecting anomalies in time series data in general is complex, generating forecasts from observability metrics tends to be even more difficult. This is partly because the best results arise from training models on a single metric, whereas observability systems may ingest millions of different metrics. The patterns of the data are also likely to be more unpredictable and exhibit characteristics such as sparsity and extreme right skew.

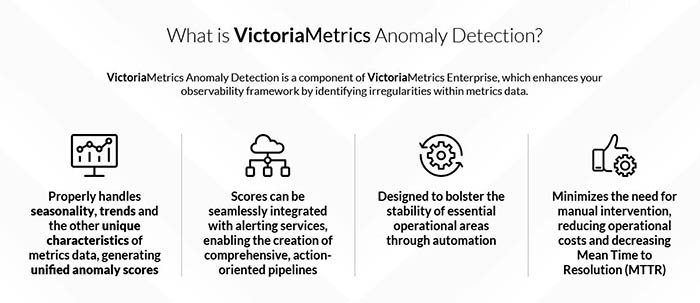
Victoria Metrics are one of the leading vendors taking on this challenge, and last year they rolled out their Anomaly Detection feature for their enterprise customers. A recent post on their blog summarises a number of key updates to their toolkit. The first of these is Presets - which can target well-known metrics types such as those generated by the Kubernetes Node Exporter. They have also released the MAD (Median Absolute Deviation) model but warn that it is not suited to seasonal or trendful data.
There is really excellent documentation both on the tooling and on anomaly detection in general on the VM web site. At the same time, these are quite sophisticated instruments and obtaining meaningful results probably requires both an understanding of the characteristics of your data sets as well as some fluency in data science principles.

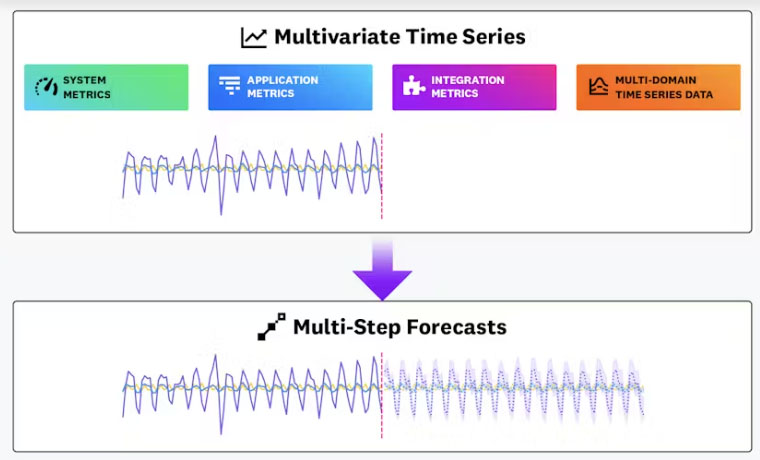
Datadog have not yet released any time series forecasting tooling to production. They have, however, recently published an update on Toto , an internal project evaluating anomaly detection methods. Toto stands for Time Series Optimized Transformer for Observability and Datadog describe it as "a state-of-the-art time series forecasting foundation model optimized for observability data".
Whilst numerous time series foundation models have been released in the past year, Datadog say that theirs is the first to include a significant quantity of observability data. In benchmarking their model, Datadog used two measures - symmetric mean absolute percentage error (sMAPE) and symmetric median absolute percentage error (sMdAPE). These are measure selected as they are designed to minimise the influence of extreme outliers which can often be found in observability data sets.
Datadog claim that on both metrics, Toto outperformed all other models used in the benchmark. Unfortunately, whilst this sounds promising, the model is still under development and it will be some time before it is deployed to production systems.