
When you look at the tone and content of many articles being written today on observability, it is hard to avoid the feeling that the discipline is at something of a crossroads. The market is expanding and diversifying rapidly. The technology is evolving and more and more companies are seeking to de-silo and harness data across multiple domains to spur on cycles of self-improvement. The explosion of telemetry data, the AI revolution, migration to the cloud, the shift to microservices and many other trends seem to be leading to a re-think of the very nature of observability theory and practice.
Up until recently, many commentators spoke of the Three Pillars of Observability – i.e. Metrics, Logs and Traces. With the inclusion of Events, this has morphed into the MELTS paradigm. Now that the OpenTelemetry project have announced the adoption of Profiling as a telemetry signal, we will need to expand the acronym once again.
In practical terms, the observability market which has grown around these concerns could be roughly divided into three categories:
Point Products – i.e. products that specialise in a subset of these concerns such as log analytics or profiling. Products such as Graylog and Prometheus would be classic examples of this type. The category would also include products such as Sentry or Victoria Metrics.
Full Stack Products – this would encompass observability platforms capable of ingesting logs, metrics and traces and providing services such analytics and diagnostics. This would include products such as SigNoz, Coralogix and Chronosphere.
Full Spectrum Products – this category refers to platforms that offer not only the ‘full stack’ of metrics, logs and traces but which also offer a range of additional enterprise services such as SLO Management, SIEM, Alerting, Profiling and, in the case of some vendors, specialist features such as LLM Observability. This would include platforms such as Datadog, New Relic and Splunk.
A number of the full spectrum (and even full stack vendors) dangle the tantalising possibility of the “Single Pane of Glass” (SPOG) – the ability to gain visibility across all of your applications and infrastructure within a single vendor offering. This is a very seductive sales pitch. It offers the prospect of tremendous power without the technical and administrative overheads of managing integrations and dealing with multiple vendors.
Whilst a single pane of glass may seem superficially desirable, it can actually be a source of tension and disenchantment. By definition, it means having one overarching system doing everything. This means that the same product is being used by both development and infrastructure teams. The problem is that these are teams with fundamentally differing needs, and it is not necessarily easy to satisfy both within one monolithic product.
Not surprisingly, the SPOG vendors regularly publish reports where they highlight the ‘problem’ of ‘tool sprawl’ and emphasise the need for 'consolidated tooling'. Tool sprawl is a rather strange condition though – vendors swear that it is a problem, but most engineers seem to be blithely unaware of it. Engineers managing observability platforms are generally techies for whom mastery of numerous tools goes with the territory. Just as a carpenter will have more than one kind of hammer and a chef will have many knives.

A further problem of the SPOG is that it can create a kind of inertia within organisations. Once you have your all-in-one solution, it becomes harder for engineers to persuade managers to adopt additional tooling – not least because there may not be interoperability with the SPOG. Often, this works to the detriment of developers since the purchasing decisions behind SPOGS are often made by infrastructure engineers – on the basis that the SPOG will be running on their infra and they will be the people installing and maintaining it. Companies such as InfraStack are developing products to meet this disconnect head-on. As they note on their blog, many systems are “primarily built to meet the needs of DevOps, Site Reliability, Traffic, and Infrastructure Experts for production workloads”.
Interestingly, solutions such as Datadog or Dynatrace, which IT managers often regard as their all-in-one solution, do not have to be procured as a monolithic product. Instead, their APM and Infrastructure monitoring capabilities can be bought as individual modules. This does open the door for a more pluralistic approach.
On the face of it, another benefit of the SPOG is the advantage of having all of your observability data consolidated into a single backend. In reality, not all vendors exploit the potential that this offers. Even though vendors may ingest the full range of telemetry signals, in some cases their architectures may still be siloed. Signals are kept in separate backend datastores and creating correlations between them can be either difficult or impossible.
This is not the case for all vendors and a number of companies have sought to meet the challenge of ‘Observability 2.0’ by either defining new architectures or seeking to synthesize complementary products. We will look at three examples of this trend. The first two, Observe and Dynatrace, have taken the unified backend/data-lake approach, whilst the third, Cisco, have taken what we might call a ‘synthetic’ approach of weaving application layers together behind a common interface. These are by no means the only companies seeking to pool, correlate or unify telemetry and business data, but we will take their approaches as examples.
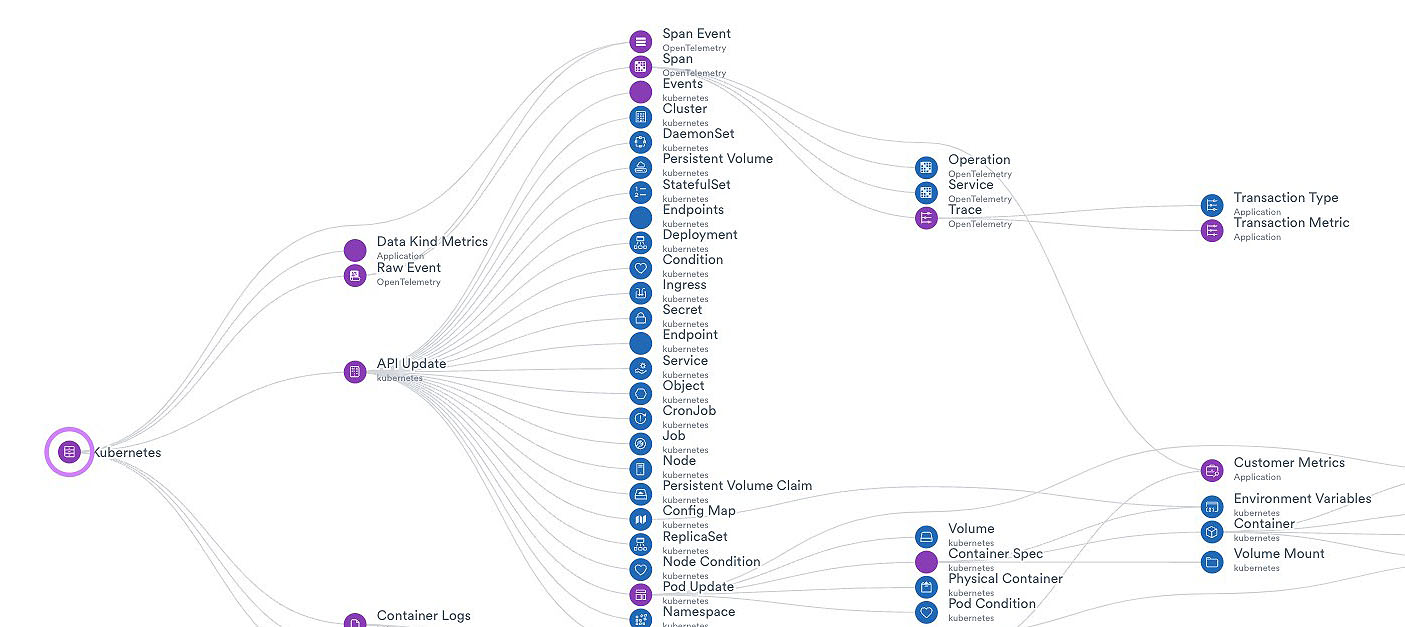 The Observe Data Graph
 Cisco FSo Platform
Whilst each of these three models provide powerful and integrated analytics, they still have their drawbacks. They still require proprietary query languages, are constrained by the limits of an API or are difficult for third party applications to access. So, what is the alternative to the single pane of glass solutions?
Many leading thinkers in the observability space have already argued that observability is a data management problem - and this is actually a very valuable perspective. Data management though, is not simply a matter of finding ways to reduce volumes or to speed up querying or improve compression rates – although those are all valuable goals.
We can also think in terms of higher-level abstractions which open up the possibility of composable observability platforms. I think that such a framework would consist of the following abstractions:
Rather than thinking in terms of a single pane of glass or a monolithic system, we could think in terms of these three functional areas and build loosely coupled architectures to support them using a plurality of tools. This would, of course, be dependent on the evolution of a standardised set of abstractions, interfaces and hooks. In this respect, Observability could follow the lead of the OpenBanking initiative – which has liberated financial data and opened the market up to a host of new vendors offering pluggable services.
As we are aware, OpenTelemetry is playing a pivotal role in defining standards and specifications for interoperability in observability frameworks. The OpenTelemetry client SDKs and the OpenTelemetry Collector are viable open source tools that end-users can deploy to build their own pipelines. For users who do not want the overhead of managing the oTel collector there is also a plethora of ready-made solutions such as FluentD and Mezmo.
The next two functional domains – storage and analytics, pose more of a challenge. What would an open and accessible backend data store – one which was easily queryable by third party tools – actually look like? One obvious answer is to store telemetry in a backend database such as ClickHouseDB – which can ingest at vast scale and query at almost unparalleled speed.
Even though there are a number of open source systems which use ClickHouseDB as their backend, many customers may not wish to incur the overhead of supporting an enterprise database infrastructure. This does not have to be a deal-breaker though – systems such as Groundcover would appear to offer the best of both worlds – an accessible backend database, but without the maintenance overhead.
The GroundCover model is a radical departure to the standard approach to observability infrastructure. With Groundcover, the storage layer runs in the customer’s own environment. You can choose to manage the infrastructure yourself, or, if you do not want to take on this overhead, you can have it remotely managed by Groundcover engineers, who will take care of guaranteeing the health of the system as well as managing patches and upgrades.
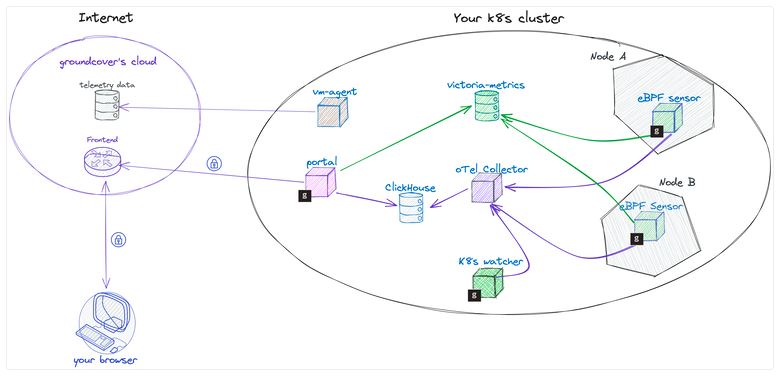 Groundcover architecture
At first glance, the architecture in the above diagram may not appear to be as unified as those of Observe or Dynatrace – after all the telemetry is spread across two separate data stores, with metrics being stored in a Victoria Metrics store and other signals being stored in ClickHouse. This is probably not particularly problematic though, since direct correlations do not generally involve metrics – they are more likely to involve traces being correlated to logs. A major benefit of this architecture is that ClickHouse is an open source database and the telemetry it stores can be queried with SQL statements. There is no need to use a proprietary API or incur the learning curve of YAQL (Yet Another Query Language).
This also opens up the possibility of building custom data lakes consisting of the Groundcover telemetry store as well as heterogenous data streams – all stored in ClickHouse and accessible from ClickHouse Views. Interestingly, Groundcover is not the only commercial platform offering this hosting model. Kloudmate is another full-stack system which utilises the OeC (OpenTelemetry/eBPF/ClickHouse) stack and which also provides an option for self-hosting of the backend infrastructure. If this kind of model becomes more widespread and reaches critical mass, then it could provide fertile ground for a whole ecosystem of providers leveraging these data stores to provide custom analytics services.
As we have stated previously, many companies are now re-imagining observability not just as a toolset but as a practice, one which transcends traditional monitoring and provides insights and visibility across multiple business domains. Chronosphere, for example, supports integrations with sources such as GitHub, Circle CI and Launch Darkly – so that telemetry can be correlated with a range of different system change events.
The recent graduation of the CNCF CloudEvents specification means that there is now a widely agreed standard for ingestion and data exchange and this is a great foundation to build upon. There are numerous other organisational data stores such as SIEM, operational support and sales analytics that could be fed into the unified backend and correlated with observability data.
In conclusion, we appear to be at an inflection point where many organisations (and some vendors) are moving away from conceptualising observability as a set of signals and instead thinking of it as a data-driven organisational practice, one which can ingest telemetry and heterogenous business data and provide unified and correlated insights across multiple domains. The single pane of glass may work for many companies. For others though, it can become a glass of pain. For those companies, a more productive option maybe the single source of truth – a universal data source which removes siloes and unleashes the potential of an open observability ecosystem.
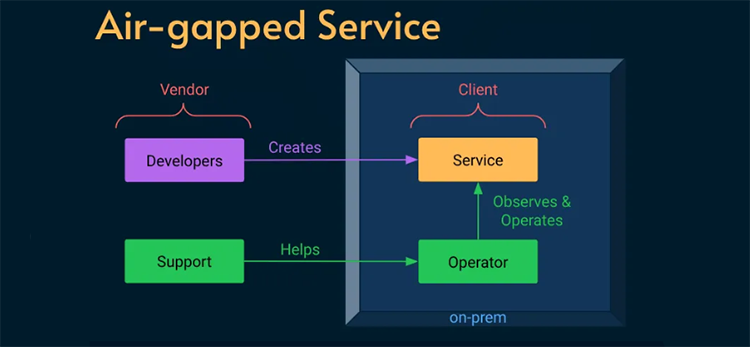
The excellent Alex Ewerlöf blog is now back in full swing and in this latest article he turns his attention to dealing with a real SRE curveball - how to build reliability engineering for an air-gapped system. We are talking hermetically sealed - not even a maintenance window for external connectivity. This task involved a high-security military facility where installing updates meant physically handing over an archive file to a system operator.
The constraints were pretty stringent - no logs, no metrics, no traces, no remote access of any kind.This was an extreme case and, ultimately, the solutions had to be both human-centred as well as relatively low-tech. How would you address the challenge? Hit the link below to read about the solution that Alex put in place.

In the past month or so the GitHub platform suffered a number of well-documented outages which resulted in loss of service for users. In the spirit of transparency, GitHub CTO Vlad Fedorov published this article on the GitHub blog, explaining the causes of the outages and the lessons learned as well as detailing the remediations that GitHub engineers will be putting in place.
The article really brings home the challenges of orchestrating the components of a global technology infrastructure - as well as the compounding effects of working at very large scale. The investigation revealed a perfect storm of edge cases, hidden tipping points and unforeseen knock-on effects. It’s impossible not to feel for the engineers sweating in the war-rooms as the dramas unfolded - after all, watching your failover fail must be pretty gut-wrenching.
If the Observability world had a code of secrecy akin to that of the Magic Circle, then Charity Majors might be in danger of being banished to exile and ignominy. In a single slide deck, she has blown the gaff on a whole trove of insider knowledge. It is the “What they don’t teach you at Harvard Business School” of observability knowledge. Not the abstract theory or technical detail but lessons and insights from the o11y frontline.
The deck in question was used in a talk at the LeadDev event in Berlin earlier this month and its 52 slides are an illuminating distillation of observability wisdom. We actually weren’t present at the talk and only came across the deck thanks to a mention in Michael Hausenblas’s excellent olly news newsletter. However, the slides contain sufficient clues (and images of unicorns) to easily re-construct the narrative and win friends and influence people as an observability savant.

If you are an SRE, when an outage happens you will know about it pretty quick. With security breaches the picture is rather less clear as, by their nature, they are designed to go undetected. Intrusion detection therefore is often based on a mixture of tools designed to spot unusual spikes, suspicious patterns or failed logon attempts.
This article by Fatih Koç argues that one of the major difficulties involved in identifying attacks is that of correlating signals across multiple sources such as Falco, Prometheus, Kubernetes Audit Logs etc. In this article, he outlines a strategy for extracting relevant data from each of these sources and pulling it together into a single observability dashboard.

The first line of cyber defence is normally at the perimeter - preventing attackers from entering your network in the first place. The next line of defence is intrusion detection. This can often take the form of anomaly detection using a variety of heuristics.
There are also some more creative possibilities, such as the canary solution adopted by Grafana. Just as the canary in the coalmine sings to alert underground workers to the presence of toxic gases, Grafana’s canary was designed to alert them to the possible presence of intruders in their domain.

Load testing can be simple in theory but in modern distributed architectures, it involves a lot more than throwing requests at an individual service. This article on the Airbnb engineering blog looks at how the company’s engineers use the Impulse load-testing framework to handle a number of more complex requirements such as dependency mockingand managing messaging and asyncronous calls.
Unfortunately, at the moment Impulse is just an internal Airbnb framework, so you won’t be able to get your hands on it at present. At the same time, the article provides a valuable blueprint for tackling advanced, real world load testing scenarios.
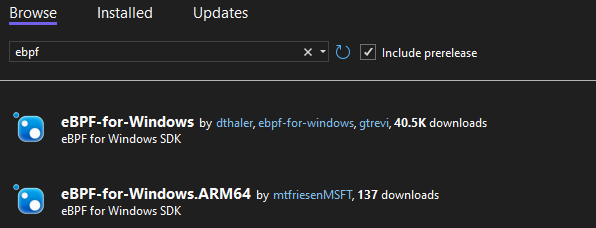
It's an announcement that might have seemed unthinkable not long ago, but the porting of the revolutionary eBPF technology to Windows is now a reality. The ability to bring safe programmability to the kernel has resulted in enormous gains in fields such as security, networking and observability for Linux hosts, so applying the same principle to the Windows ecosystem is obviously an attractive proposition. It is not, though, without its own difficulties. There were a lot of hurdles to overcome and, inevitably, given the differences in OS architecture, this is not a full-fidelity replica of the Linux implementation.
This possibly foundational article by Pavel Yosifovich guides you through the steps involved in boldly going where few have gone before and creating your first eBPF program for Windows. One paragraph in the article begins with the sentence “this is where things get a bit hairy“ - for some that will likely be a challenge rather than a deterrent. This may not be cooking up nuclear fusion in your bedroom, but it does feel pretty radical.
As well as rolling out their Open AI observability solution, Elastic have also been very active within the OpenTelemetry project. C++ has a reputation for being something of a fearsome foe for observability practitioners. In this article on the Elastic blog, Haidar Braimaanie dons his protective gear and attempts to tame the beast with a soothing dose of OpenTelemetry instrumentation.
Unlike languages built in frameworks such as .NET, C++ does not have a standardized runtime environment that supports dynamic instrumentation across all platforms and compilers. C++ also uses a variety of build systems such as Makefiles and CMake, so that implementing instrumentation can be difficult and error-prone. In the article, Haidar looks at adding OpenTelemetry support to a C++ application running on Ubuntu 22.04. He also includes sample code for instrumenting the project with database spans and then observing the application in APM.
After reading this article you may want to give the C++ developer in your life a hug.
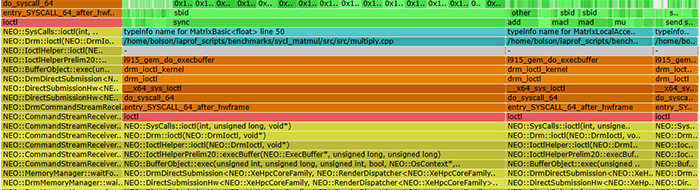
Even if you are not familiar with the name of Brendan Gregg, you are almost certainly familiar with the fruits of his labours. Brendan is the creator of the Flame Graph - one of the most important and iconic visualisations in the observability toolkit.
We featured the Flame Graph in our recent tribute to the work of UX designers in the observability arena - but you should also visit Brendans’ web site.
Brendan's latest innovation is the AI Flame Chart. This is an evolution of the original flame graph and its ambitious aim is to help reduce the vast financial and environmental costs entailed in the use of LLM’s. This means that whereas the original flame graph was focused on CPU cycles, the latest generation sets its sights on reducing GPU load. The article discusses the considerable complexities involved in mapping GPU programs back to their corresponding CPU stacks.
The names of some of the instruction sets look intimidating to the uninitiated but the basic concept of the graph is quite simple - the wider the bar, the more resource it consumes.
If you have ever had to grapple with a 3,000 line Helm chart to deploy your observability infrastructure, you may be forgiven for thinking that there must be a better way to do this. Whilst YAML has a certain formal elegance, its syntax struggles to express the architectures and relationships embedded in highly complex systems.
Whilst Pulumi have tackled this problem by enabling the use of high level programming languages for IaC, System Initiative are taking a fundamentally more radical approach. Their goal is nothing other than completely reinventing IaC from the ground up. The blog article for the launch of the product is an incredibly ambitious statement of intent. The terms ‘game changer’ and ‘paradigm shift’ tend to be thrown around somewhat casually, this might be a case where their usage is appropriate.
So, what are they proposing? Well, System Initiative is IaC without the code. It is a kind of digital canvas where you manipulate digital twins of your systems. Is the future here or is this the Platform Engineering equivalent of science fiction? Read the article and decide for yourself!