
Imagine two factories - one in London, one in Manchester. Each has a bell which rings at exactly midday to mark the end of the morning shift. Empirically, it is true that every time the bell in Manchester sounds, the workers in London will knock off for lunch. Obviously, the first is not the cause of the second. For philosophers though, the question is how do we actually know this? What is the nature of causality and how can it be observed? In their incredibly entertaining tour of mid 20th century philosophy, John Eidinow and David Edmonds relate how this seemingly frivolous question occupied the minds of thinkers such as Bertrand Russell and Richard Braithwaite in the Cambridge of the 1940's. At first glance, these arguments might seem arcane and esoteric, yet today they are still occupying researchers in the cutting-edge field of Causal AI.
This is because, whilst causality may seem obvious from a common-sense point of view, the actual mechanics can prove rather elusive. Causality seems to only manifest itself as a poltergeist, it is something that we infer from effects rather than observe directly. This is a problem that was addressed by the Scottish philosopher David Hume in the 18th century. In his book on Causal Inference and Discovery in Python Aleksander Molak summarises Hume's' position as follows:
- We only observe how the movement or appearance of Object A precedes the movement or appearance of Object B
- If we experience such a succession a sufficient number of times, we’ll develop a feeling of expectation
- This feeling of expectation is the essence of our concept of causality.
In this reading therefore, cause is not a phenomenon that we can see or experience at first hand. It is a cognitive construct that we apply on the basis of repeated experiences.
The question of causation is a fundamental concern in all kinds of observability scenarios - not just in computing but in a wide range of domains such as engineering, transport, health and many others. However, if humans struggle to define a formal system of logic for establishing cause and effect, then how can we model it in computer systems? How, from the vast mass of individual data points ingested into an observability system, can a computer program construct deterministic relationships and state, categorically, that event A and event B have a causal relationship? The question becomes even more vexed in contemporary computer architectures where code is not confined to a single executable but is distributed across decoupled components.
The revolution in AI and the massive growth of the observability market have converged to create a fertile space for companies aiming to provide a solution to this problem. One of the early movers in this space is Causely, a company which recently raised $8.8m in seed funding to "deliver the IT industry's first causal AI platform". Before delving into Causely as a product, it might be worth taking a detour around the problem domain to gain some theoretical context.
AI is a term which is being used ever more frequently in product marketing. Often, what this boils down to is the ability to make associations and correlations on the basis of machine learning. Whilst this can produce incredibly useful results in many contexts, it does have its limitations. For purposes such as root cause analysis, these limitations become especially problematic.
If you have ever used a tool such as Dall-E, you cannot fail to be impressed at its ability to turn simple text commands into compelling images. The example below, however, shows that whilst Dall-E can generate a well-formed image it has not "understood" the sense of the request. It has correctly associated words with images but the assembled result seems to reflect the patterns of the training data rather than an intelligent adaption to the request.

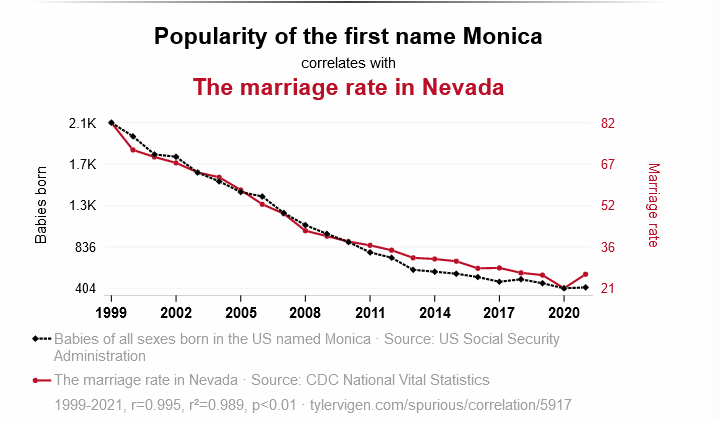
Correlation is generally regarded to be prone to two major weaknesses. The first is that correlations, even though they may be statistically strong, can often be arbitrary. A classic example is that increases in incidents of drowning can be very strongly correlated with increases in the consumption of ice cream. Whilst we could speculate that increased sugar intake from ice cream consumption may have some undesirable metabolic effects and result in swimmers getting into difficulties, this is not a convincing explanation. The common factor underlying both of these trends is increases in average temperature. As the weather gets hotter, people are more likely to go swimming and therefore more drownings are likely to occur. Some people argue that such misleading associations are rare in the real world. The example below however, is just one of a whole menagerie of spurious - and highly entertaining associations - curated on the Tyler Given web site.
The second major limitation of correlations is that they do not necessarily reveal the direction of a relationship. There is, for example, a correlation between depression and low Vitamin D consumption. What is not clear, however, is whether depression causes low Vitamin D consumption or vice versa. One of the most infamous abuses of this ambiguity over the direction of causality was framed by the statistician Ronald Fisher, in his notorious paper Cigarettes, Cancer and Statistics. In the 1950's a number of statisticians used Bayesian methods to produce a compelling case for the link between smoking and lung cancer. Fisher who was both a heavy smoker as well as a paid consultant to the tobacco industry, launched a vigorous and sustained counter-attack where he questioned whether it was actually cancer that caused smoking.

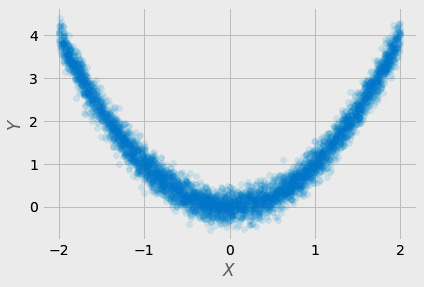
Interestingly, as the diagram below shows, it is also possible to have cause without statistical correlation. There are interesting real-life examples of these kinds of V-shaped relationships between two variables. For example, the effect of changes in temperature on the metabolism of animals. In this case, the value of 0 represents an optimal baseline. A deviation from this baseline - either positive or negative direction will result in the same upward curve of physiological stress. In some statistical methods these two trends will cancel each other out so that the correlation is low or zero.
There are a number of approaches in the field of Causal AI which can help to overcome the limitations of the correlation approach. One of these is the use of expert knowledge - a term covering various types of knowledge that can help define or disambiguate causal relations between two or more variables. Depending on the context, expert knowledge might refer to many different sources including randomized controlled trials, historic evidence, empirical data or even the laws of physics.
The seminal paper High Speed and Robust Event Correlation by Shaula Yemini et al probably represents a classic example of the expert approach. The paper dates back to 1996 but its analysis seems to be as relevant as ever. Its main thesis revolves around how an apparently tiny fault within one component unfolds a kind of butterfly effect within a larger distributed network system. It highlights how a statistically insignificant fault in a network interface results in network packets being dropped. This, in turn, leads to a throttling of the TCP window size. This has the knock-on effect of slowing down database transactions so that locks start to occur. This then has cascading effects on all services using the database. A major disruption for end users therefore results from a 0.1% loss in the capacity of a T3 network link at several removes in the causality chain. This highlights two fundamental issues:
These findings reinforce the need for root cause analyses to be embedded in frameworks of expert knowledge. As the authors state:
"to determine which events to monitor operational staff must be familiar with the operational parameters of each managed object"
The authors of the paper define a strategy which they refer to as 'coding'. This is not coding in the sense of writing a computer program. Instead, it involves identifying all of the particular symptoms of an exception and then grouping them together to create a unique profile. This kind of fingerprinting is a powerful and performant tool for identifying patterns within streams of telemetry data and mapping them back to known causes.
Circling back to Causely, it is the application of these principles that underpins its root cause analysis capabilities. At the moment, you will need to book a demo to see the product in action. However, we can get a flavour of its functionality from videos posted on the Causely web site.
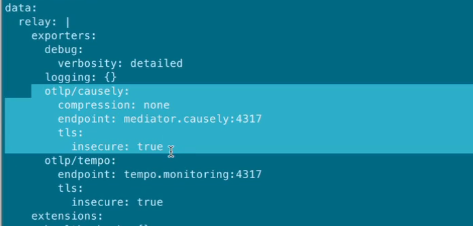
The first video we will look at covers how Causely identifies causal relationships from OpenTelemetry traces (although it also has integrations for eBPF and Istio to support service discovery). Although this does not require any instrumentation at the code level, it obviously assumes that you are collecting trace telemetry. In terms of configuration, all you need to do is export your traces to the Causely endpoint (in a real-world case, you would obviously not use the insecure TLS option).
Causely can detect problem conditions from your trace data and assemble a graph of the issue - it can then correlate this with its own models to identify root causes. By taking this approach it can achieve a higher level of determinism whilst needing less raw data and less compute power. What is interesting is that Causely can use its expert knowledge to define a potential or actual problem autonomously. It can then combine this intelligence with its knowledge of the service graph to predict effects on dependent services. In the example below it has identified an Inefficient Locking issue:
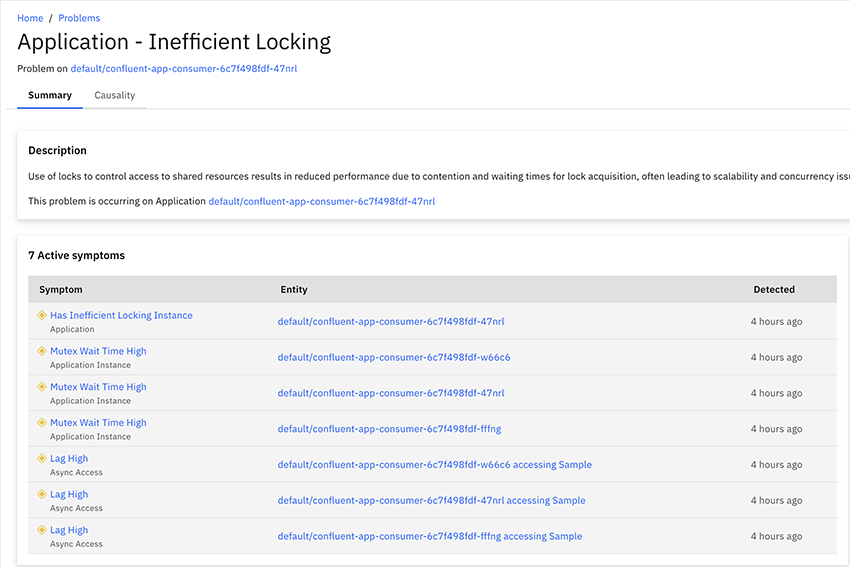
We can then drill down and see the components affected by this issue:
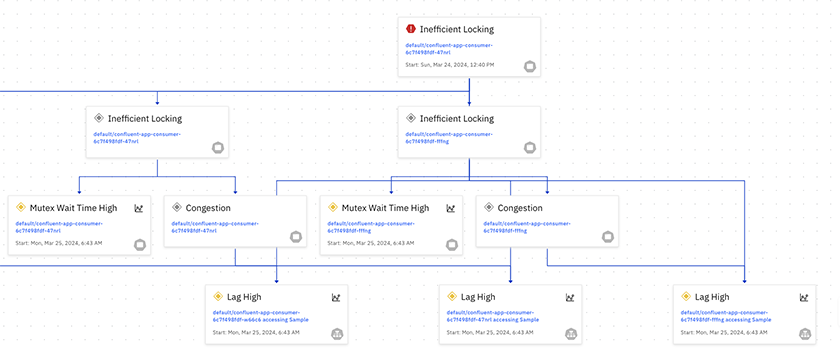
Many monitoring systems identify errors on the basis of testing binary states or predefined signals and codes - e.g. pinging an endpoint or capturing output to stderr. On the basis of these videos Causely is able to autonomously identify which values in a dataset may represent a problem state - it does not have to be 'trained' to search for predefined, thresholds or ranges. If this is the case, then this is an advanced capability absent from most other products on the market.
The second video looks at a common scenario - asynchronous failures in a distributed services system. The screenshot below depicts the architecture for a sample application:
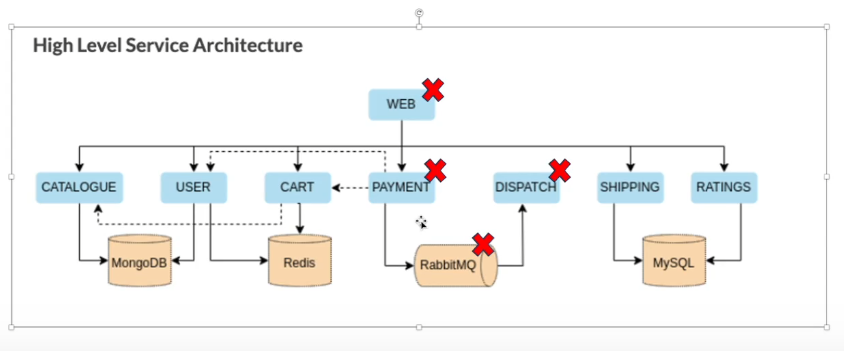
We can see that if there is a failure in the RabbitMQ service, it will cascade in multiple directions. At this point, many monitoring systems may start sending discrete streams of error messages for each of the affected services - but without linking them to a root cause. In Causely, these individual error conditions can be viewed in the Symptoms screen:

In the defects screen, Causely will display a list of error conditions which are at the root of downstream issues:

We can see here that one of our defects is a memory failure in the RabbitMQ instance. If we now click on this we can view the causality chain of affected services:
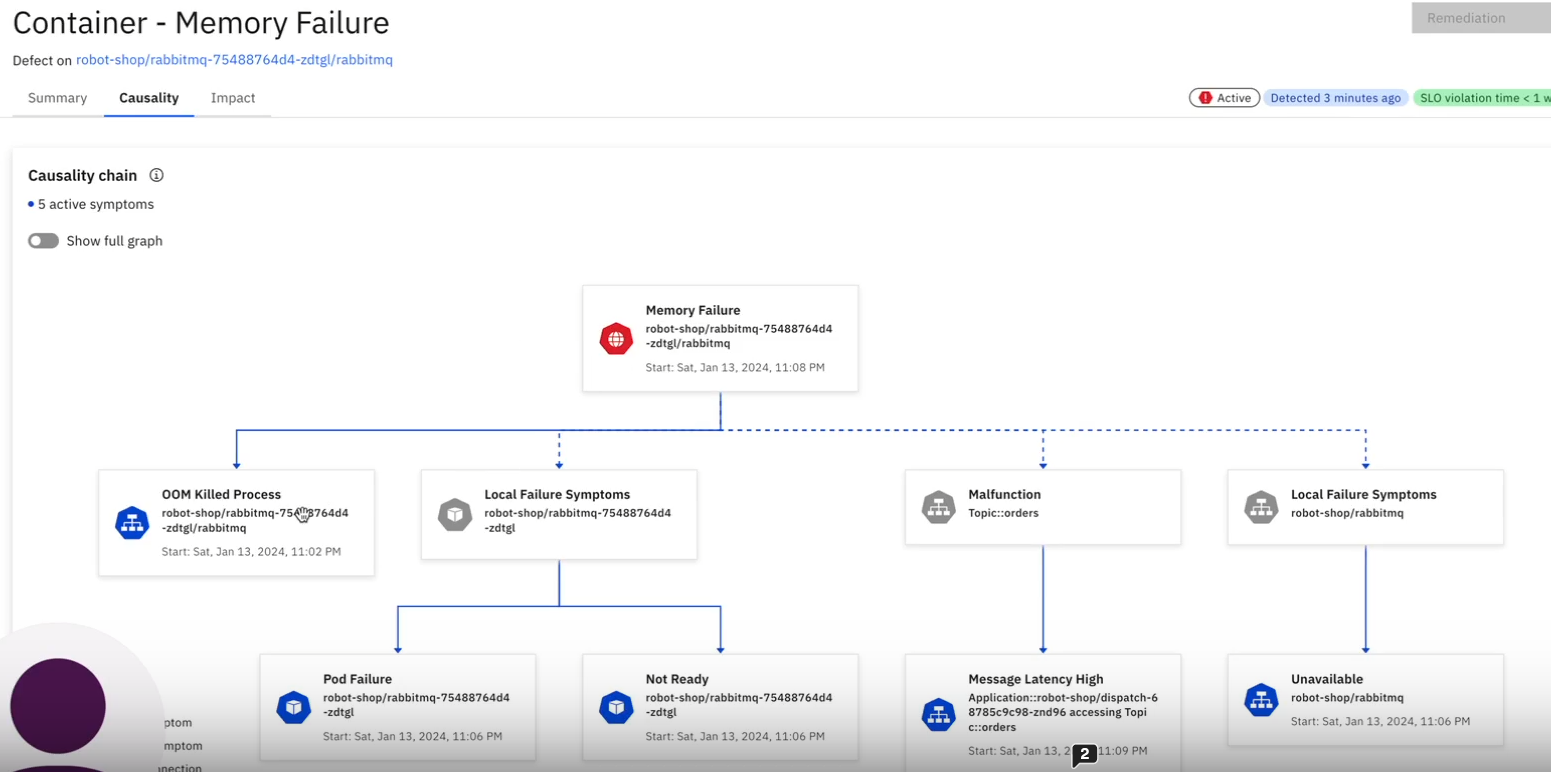
This gives great visibility of the system-wide impact of a root defect. What is also really interesting here is that Causely does not restrict itself just to displaying outages or run time errors, it is also able to identify downstream conditions such as latency issues. Another really powerful feature is Causely's ability to use its understanding of system relationships to perform what-if analysis. The screenshot below shows Causely's 'Potential Defects' screen.

What is fascinating here is that these are potential scenarios. These are faults that have not yet happened. For the purposes of preventative maintenance though, we can now drill down and gain an understanding of the possible impacts:

This is a useful tool for preventive maintenance, SLO management and site reliability planning.
Today's enterprise software systems can represent significant challenges when engineering teams need to tackle errors and outages. Applications tend to have more layers of abstraction, more pluralistic architectures and vastly more complex graphs. In these scenarios, failures tend to be not only more costly but also more difficult to locate. A tool that can apply expert knowledge and trace an error back through several system layers to its point of origin can be of immense value.
Causely is not intended to be a replacement for your existing observability stack. As an integration into your existing system however, it has the potential to massively reduce MTTR and enhance reliability.
I would like to express my gratitude to Andrew Mallaband for all of his help and advice in preparing this article. I would highly recommend getting in touch with him if you are looking for a guide in navigating this terrain.
If you are interested in the field of Causal Science, then the best starting point is probably The Book of Why by Judea Pearl - who is widely regarded as the leading authority in the field.
If you want to keep up with the latest news on Causal AI then I would highly recommend subscribing to the Causely newsletter.
Cigarettes, Cancer and Statistics by Ronald Fisher
High Speed and Robust Event Correlation by Shaula Alexander Yemini et al
Wittgenstein's Poker by David Edmonds and John Eidinow
Causely raises $8.8M in Seed funding Causely Press Release
Causal Inference and Discovery in Python by Aleksander Molak
Spurious Correlations by Tyler Given
Cracking the code of complex tracing data Causely web site video
Causely for asynchronous communication Causely web site video