


If you are visiting FOSDEM for the first time, then the experience can be both bewildering and overwhelming. Set on the sprawling campus of the Universite Libre Brussels, it attracts in excess of 8,000 visitors and includes more than 800 lectures.
If, like us, you were a first time visitor it is easy to feel a sense of dislocation as you criss-cross the terrain from one warren of bunker-like corridors to another. However, the small fleet of rock festival size food trucks selling pizza, Belgian waffles and french fries are a very useful reference point for meeting friends and getting your bearings.
Whilst the ethos of the event is open source (entry is free and you don't even have to register), it obviously needs to cover its costs. Luckily, though, the commercial sponsors who support FOSDEM keep a low profile and the sessions are technical in nature rather than being marketing-driven.
It is a vast conference with a huge number of streams - each of which has its own location (referred to as a devroom). One of the most eagerly awaited sessions in the Observability DevRoom was Nikola Grcevski and Mario Macias of Grafana Labs showcasing their eBPF-powered Beyla product. They didn't disappoint and the audience were rewarded with an amazing demonstration of zero instrumentation tracing. The queues for the DIY Observability talk were long enough for people to be posting photos of them on Twitter. In the space of 20 minutes, Robert Hodges walked through the process of setting up a fully open source telemetry pipeline.
We mentioned Quickwit in our last newsletter. Company Co-founder François Massot also received an enthusiastic reception for his demonstration of the product's ability to ingest telemetry at scale and search at high speed. Those are just some of the highlights of a hugely successful day in the Observability DevRoom. If you were unable to attend we have compiled below a listing of videos and slide decks from each presentation.
AutoInstrumentation for Node.js on Kubernetes by Richard Hartmann
Video recording
When Prometheus Met OpenTelemetry by Pavol Loffay
Video and slides
Strategic sampling: Architectural Approaches to Efficient telemetry by Benedikt Bongartz, Julius Hinze
Slides
Unifying Observability: The Power of a Common Schema by Christos Markou, Alex Wert
Video and slides
Linux load average and other silly metrics by Franck Pachot
Video and slides
Fast cheap DIY Monitoring by Robert Hughes
Video
Implementing distributed traces with eBPF by Nikola Grcevski, Mario Macias
Video
What’s possible in observability when we have frame pointers by Matthias Loibl, Jon Seager
Video and Slides
Modern application observability with Grafana and Quickwit by Francois Massot
Slides
What is CI/CD observability, and how to bring observability to CI/CD pipelines? by Dimitris Sotirakis, Giordano Ricci
Slides
Introducing Observability to an airline by James Belchamber
Video
Netdata: Open Source, Distributed Observability Pipeline - Journey and Challenges by Costa Tsaousis
Slides
A final thought - we are going to need a bigger DevRoom for 2025!
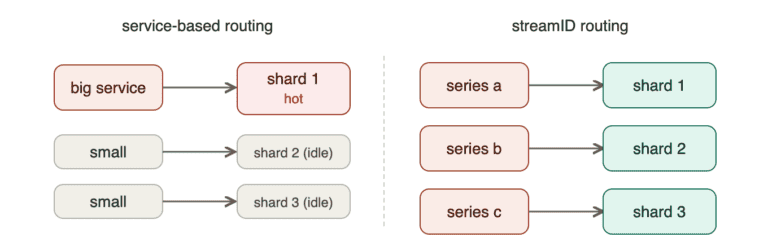
This is an article from the CNCF blog that, although relatively brief, tells the story of an epic IT project. Atlassian are a huge presence in the DevOps space and they operate a correspondingly large-scale metrics infrastructure – 100k hosts running across 14 regions. The task facing the engineering team was to migrate the entire system from their legacy gostatsd (no - that’s not a spelling mistake :-)) implementation to OpenTelemetry.
With thousands of services running across multiple different platforms, the option of simply ripping out gostatsd and switching to OpenTelemetry in one big bang project was not on the table. As the authors note, “the obvious plan (tear out the old pipeline, get every team to re-instrument on the oTel SDK, flip the switch) is a pipe dream”.
This is a really illuminating article that records the engineering decisions that the team made to ensure the successful delivery of a major project.
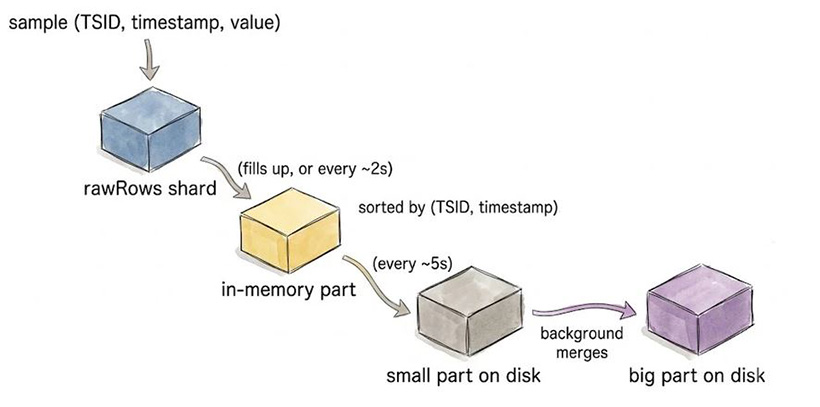
A lot of conversations about metrics tend to take a widescreen view – dealing with issues of cardinality explosions and hyperscale ingestion. This article by Jesús Espino at VictoriaMetrics takes a more atomic view, looking at the anatomy and lifecycle of a single metric as it is created in memory, travels over the wire and journeys through an observability backend.
This may sound dry and technical, but it unfolds almost like a nature documentary - all that’s missing is a David Attenborough voiceover as our humble metric metamorphoses and migrates across habitats. This is an article that really sheds light on the intricacies of metrics processing and the engineering that goes into maximising performance and optimising storage efficiency at a low level.
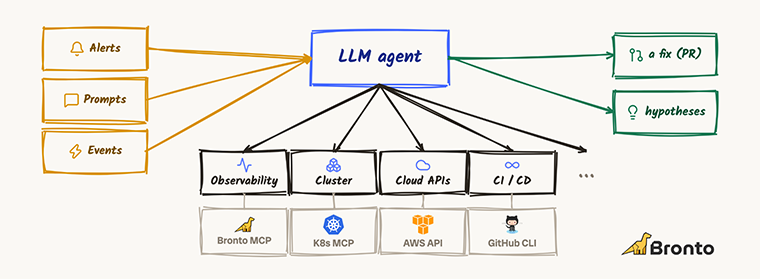
AI SREs seem to be everywhere at the moment – both as standalone products and integrated into observability platforms. There is also something of a mystique around them – their algorithms are the IP of the vendor and their training is a closed book. That makes it hard to judge whether a product fits your environment, or even which questions to ask.
As Severin Neumann argues in this blog article, one of the best ways to learn more is to build your own. Even if it never sees the light of day in your production environment, the lessons learned along the way will be worth the effort. This is not just a theoretical post, there is a hands-on lab that will take you step by step through the whole process.
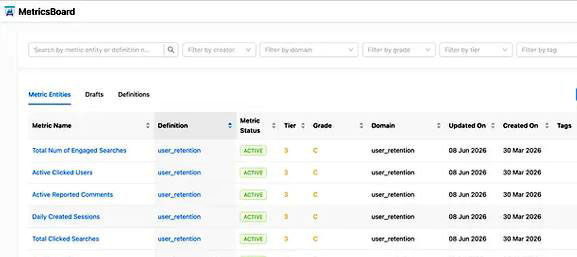
Copying hyperscalers’ engineering practices wholesale is a familiar anti-pattern. Sometimes, though, their solutions do scale down. Metrics sprawl is a near-universal headache, and Pinterest’s account of building a unified metrics layer has lessons for those of us operating at humbler scales. With many teams minting custom business metrics and running experiments, duplication was rife, and practices for monitoring and managing metadata drifted apart. The solution was a metrics board – a semantic layer ensuring that metrics were defined consistently and exposed through a single interface. Pinterest work at a scale that meant their implementation required some sophisticated plumbing, but the core idea of a centralised discovery layer as a single source of truth for metrics would probably deliver an ROI for most teams.
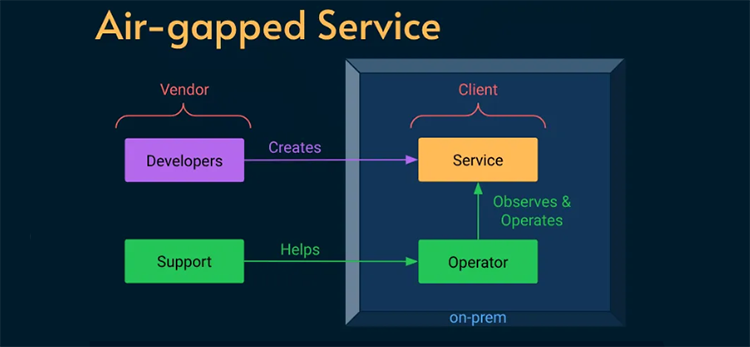
The excellent Alex Ewerlöf blog is now back in full swing and in this latest article he turns his attention to dealing with a real SRE curveball - how to build reliability engineering for an air-gapped system. We are talking hermetically sealed - not even a maintenance window for external connectivity. This task involved a high-security military facility where installing updates meant physically handing over an archive file to a system operator.
The constraints were pretty stringent - no logs, no metrics, no traces, no remote access of any kind.This was an extreme case and, ultimately, the solutions had to be both human-centred as well as relatively low-tech. How would you address the challenge? Hit the link below to read about the solution that Alex put in place.

In the past month or so the GitHub platform suffered a number of well-documented outages which resulted in loss of service for users. In the spirit of transparency, GitHub CTO Vlad Fedorov published this article on the GitHub blog, explaining the causes of the outages and the lessons learned as well as detailing the remediations that GitHub engineers will be putting in place.
The article really brings home the challenges of orchestrating the components of a global technology infrastructure - as well as the compounding effects of working at very large scale. The investigation revealed a perfect storm of edge cases, hidden tipping points and unforeseen knock-on effects. It’s impossible not to feel for the engineers sweating in the war-rooms as the dramas unfolded - after all, watching your failover fail must be pretty gut-wrenching.

If the Observability world had a code of secrecy akin to that of the Magic Circle, then Charity Majors might be in danger of being banished to exile and ignominy. In a single slide deck, she has blown the gaff on a whole trove of insider knowledge. It is the “What they don’t teach you at Harvard Business School” of observability knowledge. Not the abstract theory or technical detail but lessons and insights from the o11y frontline.
The deck in question was used in a talk at the LeadDev event in Berlin earlier this month and its 52 slides are an illuminating distillation of observability wisdom. We actually weren’t present at the talk and only came across the deck thanks to a mention in Michael Hausenblas’s excellent olly news newsletter. However, the slides contain sufficient clues (and images of unicorns) to easily re-construct the narrative and win friends and influence people as an observability savant.

If you are an SRE, when an outage happens you will know about it pretty quick. With security breaches the picture is rather less clear as, by their nature, they are designed to go undetected. Intrusion detection therefore is often based on a mixture of tools designed to spot unusual spikes, suspicious patterns or failed logon attempts.
This article by Fatih Koç argues that one of the major difficulties involved in identifying attacks is that of correlating signals across multiple sources such as Falco, Prometheus, Kubernetes Audit Logs etc. In this article, he outlines a strategy for extracting relevant data from each of these sources and pulling it together into a single observability dashboard.

The first line of cyber defence is normally at the perimeter - preventing attackers from entering your network in the first place. The next line of defence is intrusion detection. This can often take the form of anomaly detection using a variety of heuristics.
There are also some more creative possibilities, such as the canary solution adopted by Grafana. Just as the canary in the coalmine sings to alert underground workers to the presence of toxic gases, Grafana’s canary was designed to alert them to the possible presence of intruders in their domain.

Load testing can be simple in theory but in modern distributed architectures, it involves a lot more than throwing requests at an individual service. This article on the Airbnb engineering blog looks at how the company’s engineers use the Impulse load-testing framework to handle a number of more complex requirements such as dependency mockingand managing messaging and asyncronous calls.
Unfortunately, at the moment Impulse is just an internal Airbnb framework, so you won’t be able to get your hands on it at present. At the same time, the article provides a valuable blueprint for tackling advanced, real world load testing scenarios.
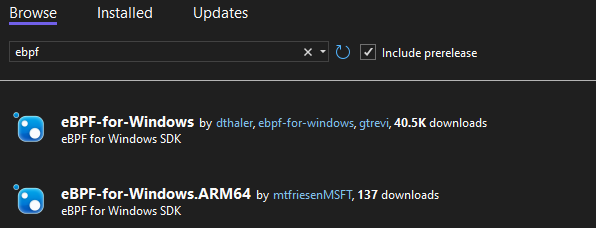
It's an announcement that might have seemed unthinkable not long ago, but the porting of the revolutionary eBPF technology to Windows is now a reality. The ability to bring safe programmability to the kernel has resulted in enormous gains in fields such as security, networking and observability for Linux hosts, so applying the same principle to the Windows ecosystem is obviously an attractive proposition. It is not, though, without its own difficulties. There were a lot of hurdles to overcome and, inevitably, given the differences in OS architecture, this is not a full-fidelity replica of the Linux implementation.
This possibly foundational article by Pavel Yosifovich guides you through the steps involved in boldly going where few have gone before and creating your first eBPF program for Windows. One paragraph in the article begins with the sentence “this is where things get a bit hairy“ - for some that will likely be a challenge rather than a deterrent. This may not be cooking up nuclear fusion in your bedroom, but it does feel pretty radical.
As well as rolling out their Open AI observability solution, Elastic have also been very active within the OpenTelemetry project. C++ has a reputation for being something of a fearsome foe for observability practitioners. In this article on the Elastic blog, Haidar Braimaanie dons his protective gear and attempts to tame the beast with a soothing dose of OpenTelemetry instrumentation.
Unlike languages built in frameworks such as .NET, C++ does not have a standardized runtime environment that supports dynamic instrumentation across all platforms and compilers. C++ also uses a variety of build systems such as Makefiles and CMake, so that implementing instrumentation can be difficult and error-prone. In the article, Haidar looks at adding OpenTelemetry support to a C++ application running on Ubuntu 22.04. He also includes sample code for instrumenting the project with database spans and then observing the application in APM.
After reading this article you may want to give the C++ developer in your life a hug.
Even if you are not familiar with the name of Brendan Gregg, you are almost certainly familiar with the fruits of his labours. Brendan is the creator of the Flame Graph - one of the most important and iconic visualisations in the observability toolkit.
We featured the Flame Graph in our recent tribute to the work of UX designers in the observability arena - but you should also visit Brendans’ web site.
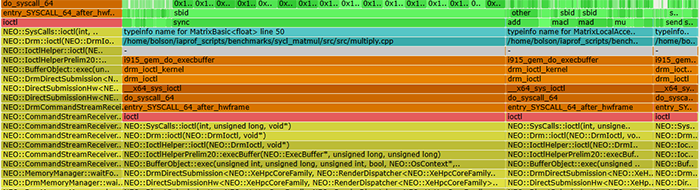
Brendan's latest innovation is the AI Flame Chart. This is an evolution of the original flame graph and its ambitious aim is to help reduce the vast financial and environmental costs entailed in the use of LLM’s. This means that whereas the original flame graph was focused on CPU cycles, the latest generation sets its sights on reducing GPU load. The article discusses the considerable complexities involved in mapping GPU programs back to their corresponding CPU stacks.
The names of some of the instruction sets look intimidating to the uninitiated but the basic concept of the graph is quite simple - the wider the bar, the more resource it consumes.
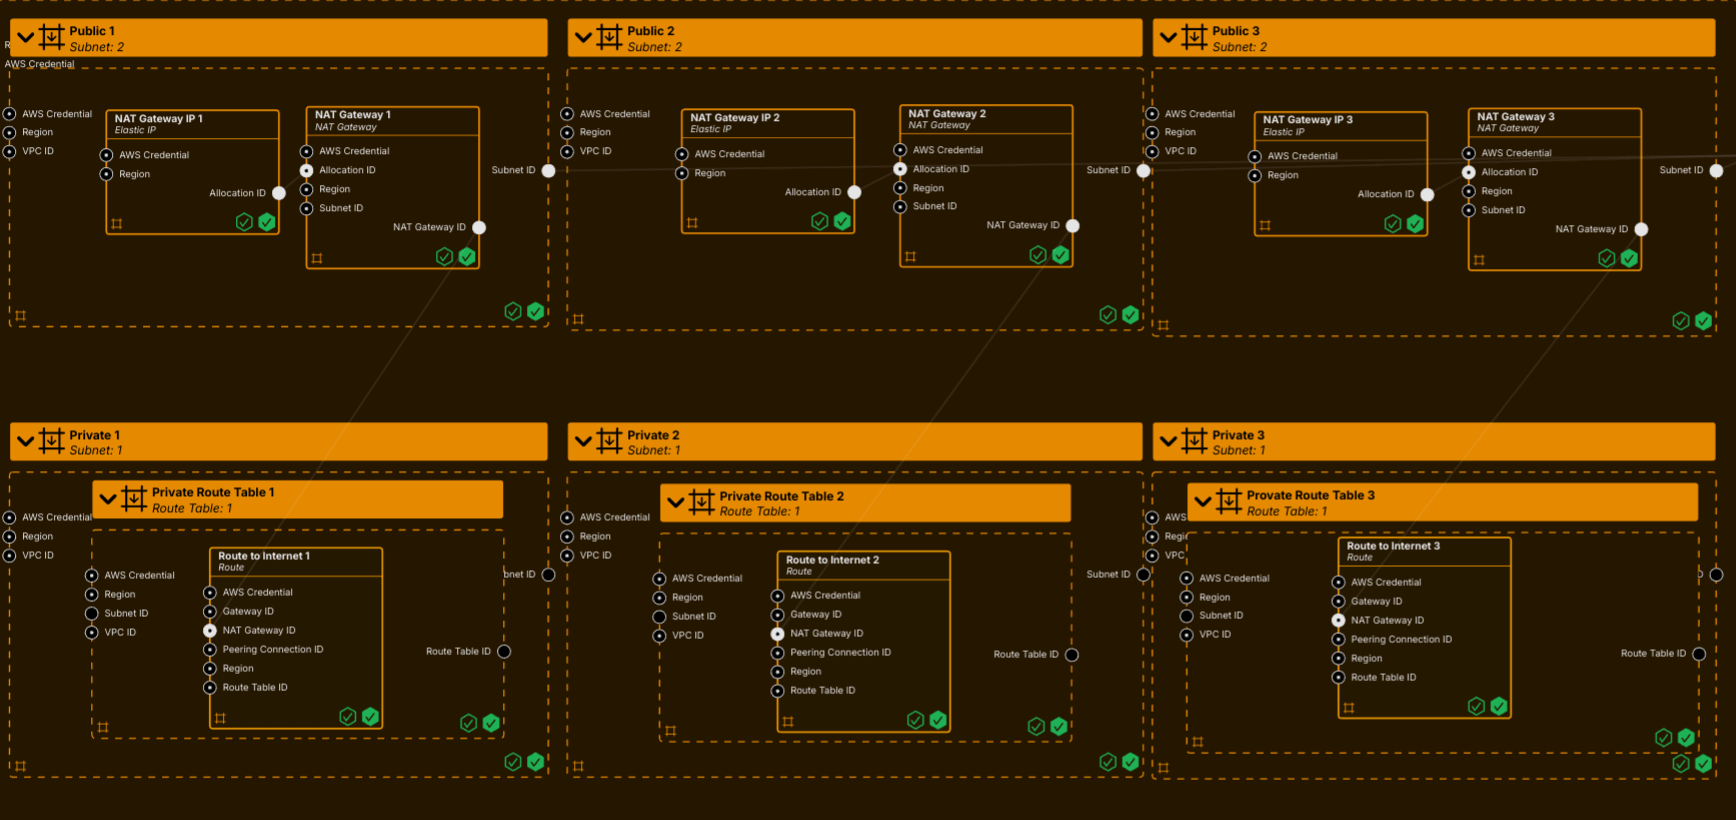
If you have ever had to grapple with a 3,000 line Helm chart to deploy your observability infrastructure, you may be forgiven for thinking that there must be a better way to do this. Whilst YAML has a certain formal elegance, its syntax struggles to express the architectures and relationships embedded in highly complex systems.
Whilst Pulumi have tackled this problem by enabling the use of high level programming languages for IaC, System Initiative are taking a fundamentally more radical approach. Their goal is nothing other than completely reinventing IaC from the ground up. The blog article for the launch of the product is an incredibly ambitious statement of intent. The terms ‘game changer’ and ‘paradigm shift’ tend to be thrown around somewhat casually, this might be a case where their usage is appropriate.
So, what are they proposing? Well, System Initiative is IaC without the code. It is a kind of digital canvas where you manipulate digital twins of your systems. Is the future here or is this the Platform Engineering equivalent of science fiction? Read the article and decide for yourself!