For a long time, log querying UI’s were almost an oasis of familiarity in an ever-changing world. You ticked a few options, entered a query and then waited until the screen filled up with rows of results. Gradually though, it seems as if the tides of AI and automation are creeping in. Last year, AWS announced support for AI-powered natural language querying in Cloudwatch, and recently both Azure and Grafana have announced upgrades to their log querying capabilities.
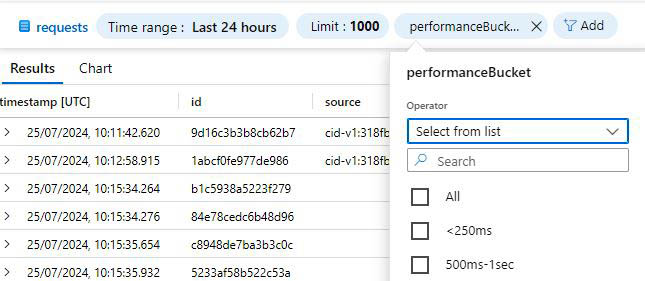
Up until recently, querying logs in Azure Monitor required a knowledge of Kusto - the Azure query language. With the introduction of Log Analytics Simple Mode, users can now easily filter by any field in a table using dynamically generated drop down lists. It is also possible to generate simple aggregations just by pointing and clicking.

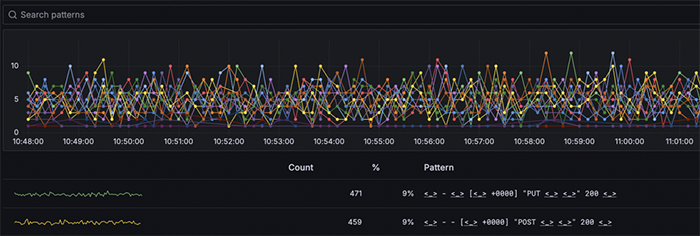
Grafana have also introduced an Explore Logs feature, which is designed to help engineers use logs to resolve errors without the need for writing complex queries. This is a much more visual experience than the Microsoft update. Explore Logs presents an array of graphs representing logging flows. Users can then zoom in on anomalous activity. There are also extremely powerful built-in analytics such as Patterns, which group together logs with similar textual content so that they can either be investigated further or eliminated from the diagnostics process.
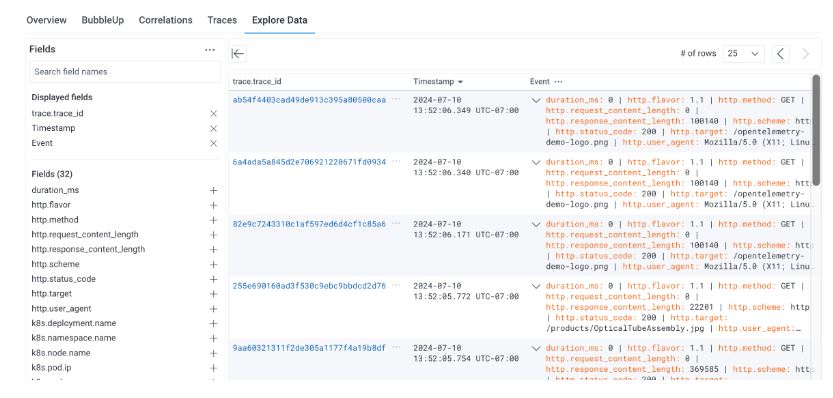
Meanwhile, Honeycomb have also been busy upgrading their log querying experience with the addition of a new Explore Data tab, which is displayed when viewing query results. This allows users to run further queries on the results set using simple point and click gestures.

There are also options for adding and removing fields, reformatting and exporting your data. As you would expect from Honeycomb, you can also easily view correlations with other telemetry such as traces.
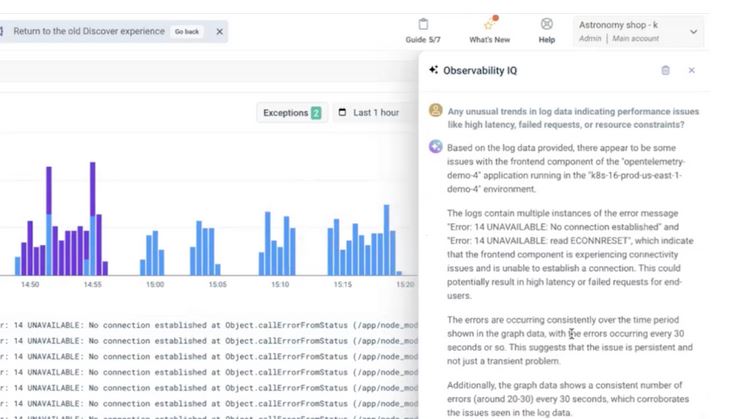
Logz.io have also launched a major upgrade of their log management functionality - with a heavy emphasis on AI. The most most exciting innovation is the integration with the Observability IQ Assistant. This uses a Chat UI to allow users to run natural language queries to find patterns in their data. For example, a user might ask "are there any unusual trends indicating latency issues". This really takes loq querying to a whole new level.

In addition to this, a new Simple Search feature aims to simplify searching via an intelligent auto-complete feature. As you start typeing Simple Search will provide suggestions for fields to include based on your previous searches. The query engine has also been re-engineered so users should now experience much shorter wait times for results, whilst there are also UI tweaks such as allowing resizing of the data table.