Up until quite recently, observability was pretty much synonymous with the proverbial "Three Pillars" of Logs, Metrics and Traces. Ingesting, storing and displaying these three signals was pretty much the definition of a Full Stack observability product. Naturally, for a number of years, top-end systems have gone beyond these basic requirements but essentially, supporting log aggregation, APM and dashboards meant you were covering all the bases.
Over the past year or so, though, it seems as though the table stakes have been raised. If you want to get into the game, then you are going to have to throw more functionality into the pot. Most likely this is the result of the increasingly competitive nature of the marketplace. The past few years have seen something of a Cambrian explosion in the observability space, with a host of new entrants coming into the market – GroundCover, Coroot, HyperDX and Betterstack to name but a few.
As vendors need to stand out and differentiate themselves from competitors, they will naturally add new features. The good news for customers is that these are actually features which add genuine value to the product, they are not just bells and whistles. There also appear to be different forces driving these innovations. On the one hand there are functional enhancements, driven by new or unfulfilled existing customer need. On the other hand, there are the new possibilities that have been opened up by advances in technology – particularly in the field of AI.
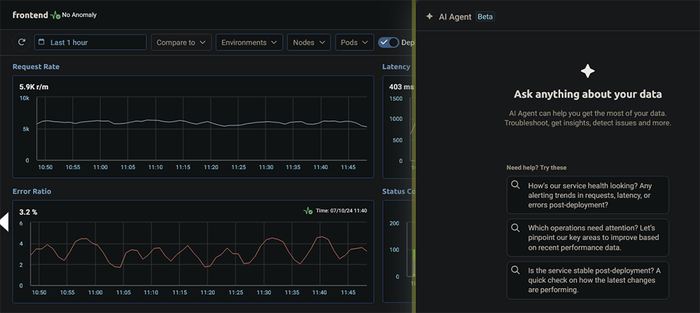
So, what are some of the features that will soon be bundled with the standard package? Well, first up is Anomaly Detection. Accurate and meaningful anomaly detection has been the Scarlet Pimpernel of observability - they seek it here, they seek it there, despite recent advances in machine-learning and AI though, it has remained highly elusive. This is partly due to the particular nature of Observability datasets. They tend to have highly irregular distributions and characteristics that do not lend themselves easily to many of the established anomaly detection algorithms. This naturally makes developing commoditised solutions difficult. If you are interested in finding out more, then this paper from Datadog does a good job of explaining some of the technical and mathematical complexities.
Despite these challenges, a number of vendors are now bringing solutions to the market. In recent months SigNoz, Victoria Metrics and Kloudfuse have all introduced Anomaly Detection tooling. The caveat though, is that this is not quite a magic bullet. Anomaly detection algorithms are not a one size fits all proposition. The Victoria Metrics implementation supports a number of different models. However, as their documentation points out, each model has its own assumptions - so you need to select the model which has the best fit with the profile of a particular dataset.
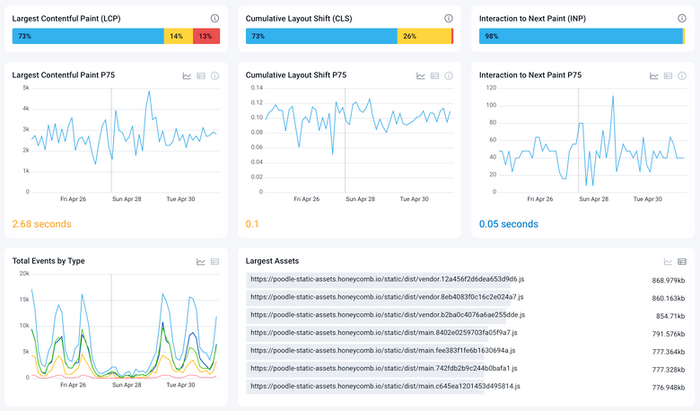
The next feature goes by a number of names – RUM, Front End Observability, Browser Observability – to mention a few. The ultimate goal though, is all about understanding and improving the user experience of your applications.
Arguably, for a long time, the focus of application observability has been on the back end – with an abundance of metrics for CPU usage, memory consumption, database latency, http 5xx errors etc. In an age of Single Page Applications and front end frameworks such as React and Angular, this means that a whole layer of application architecture has been neglected. In October, Honeycomb launched their Front End Observability tooling and vendors such as Kloudfuse, New Relic and Middleware have been busy rolling out or upgrading their own RUM functionality.

It is not always easy to tell exactly where we are with regard to the AI Hype Cycle. Certainly, some very big promises have been made – but we have not yet seen SRE’s being replaced by robots. Up until quite recently, the AI features in observability tooling were largely convenience functions such as automatically generating a title for a dashboard tile. Over the past few months however, a number of vendors have started to rollout some more substantial features, with a lot of effort being invested into reducing MTTR.
At one time, Root Cause Analysis meant a pretty laborious process of manual querying of logs and then cross-referencing with traces or even with logs etc from other sources. This is no longer good enough. Observability applications need to provide a more intelligent experience. They need to be able to detect failures and intelligently correlate telemetry across signals and across services.
We are now seeing this kind of functionality being rolled out by vendor after vendor. Grafana recently unveiled their Explore apps suite, which enables users to achieve insights into their telemetry without having to run queries. They have also rolled out a suite of AI-driven workflows for root cause analysis, built on the Asserts technology they acquired last year.
Logz.io are a company that have diligently held back from overplaying the possibilities of AI, but they have now also released their Observability IQ Assistant - which they describe as a "conversational AI" tool. Rather than searching through logs, users can ask questions such as "how is our service health" or "where do we need to improve performance". They have also rolled out their AI Agent which, they claim, can reduce Root Cause Analysis time by up to 70%. Similar capabilities are being developed or released by many more vendors in the space

Interestingly, this is not just happening in the observability mainstream. LLM API's such as Open AI, Llama and Claude are great levellers, enabling niche and point providers to compete on equal terms. Kerno and Causely, for example, ship with powerful root cause analysis features. Kerno can quickly identify the relevant line of code and even the relevant Git commit.
Root Cause Analysis is obviously just a diagnostic activity. A number of vendors are looking at taking the next step - automated incident resolution. Some vendors even talk about the ambitious goal of ‘closing the loop’ – i.e. a completely automated cycle of detection, identification and resolution without any human intervention. Whilst a number of specialist applications are already generating playbooks and scripts to resolve relatively routine issues it will require a quantum leap forward before most of us are willing to hand full control of our platforms to our friendly, neighbourhood robo-admins.
In this article I have just highlighted three of the areas in which vendors are now building added value into their products. There are also many more capabilities that vendors are offering as they move away from the three pillars baseline. Features such as LLM Observability, Incident Management, Mobile Observability and ingestion control planes are also appearing in product offerings. I am not suggesting that all of these capabilities will be essential in all applications across the board. It does seem, however, that the Three Pillars are now more of a foundational layer rather than representing the whole edifice of observability For some time, there has been an almost existential question mark hanging over observability. A lot of critics have asked what benefits observability tooling is actually bringing to justify the sometimes enormous costs involved. It seems to me that we are now at an inflection point where vendors are competing to add features that will bring real value to customers.