
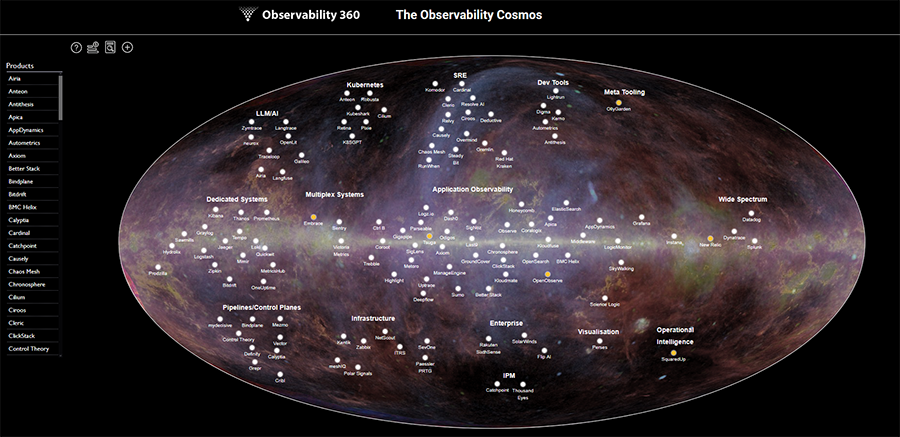
This initial iteration covers 125 products across 16 categories. The categories themselves will inevitably evolve as the market does.
As the name says, these are systems that focus on one particular specialism. Generally, this means that the application focuses one particular telemetry signal. In the past year or so there has been a noticeable upsurge in the number of log aggregation specialists.
By focusing on a single telemetry type, these tools often provide deeper query capabilities and more cost-effective storage than generalist platforms. They are frequently used as "best-of-breed" components within a larger, composable observability strategy.
This is one step along the road from dedicated systems and implies a product that covers more than one signal or vertical but is not a unified telemetry or full stack observability platform. Embrace would have originally been assigned to the dedicated category as they initially specialized in mobile observability. Since then they have branches out into RUM for web apps and now find themselves in the multiplex category.
These systems serve teams that need specialized visibility into specific domains, such as mobile or frontend, without the overhead of a backend-centric enterprise suite. They bridge the gap between niche specialization and broader situational awareness.
These are systems which process the full set of telemetry signals and are able to provide sophisticated analytics and correlation. Whilst they may support infrastructure observability, in general they tend to have more of a developer orientation.
They prioritize the interconnectedness of data, allowing users to pivot seamlessly between traces and logs to accelerate root cause analysis. This category is often defined by a "standards-first" approach, heavily leveraging frameworks like OpenTelemetry.
A generally agreed definition of Full Stack is that these systems are capable of providing end to end observability across all layers of the technology stack.
They offer a "single pane of glass" that connects hardware performance and cloud resources directly to application logic and user experience. This holistic view is designed to break down silos between ITOps, DevOps, and SRE teams.
These are the observability behemoths. They have large market share, large R&D budgets and extend their reach into realms such as Incident Management, SIEM, CI/CD and Business Analytics.
These platforms aim to be the central nervous system of the entire IT organization, subsuming adjacent categories like security and workflow automation. Their value proposition lies in portfolio consolidation and the ability to correlate technical performance with high-level business outcomes.
This is obviously a relatively new sector and it is one that is evolving rapidly as AI development skyrockets and Agentic AI proliferates. These vendors go beyond tracing and token counting to provide deep coverage of concerns such as governance, security and evaluation.
They address the non-deterministic nature of AI by monitoring prompt drift, hallucination rates, and model latency in real-time. This ensures that the "black box" of LLMs remains transparent and accountable to the engineers building with them.
Kubernetes is almost an industry in its own right and has built up an ecosystem of auxiliary products across a whole number of concerns.
These tools are purpose-built to navigate the ephemeral nature of containers, offering deep insights into cluster health, pod resource allocation, and service mesh traffic. They translate the complex abstractions of orchestrated environments into actionable data for platform engineers.
SRE AI is currently the Large Magellanic Cloud of our galaxy, a seething nebula where young stars form in the white heat of innovation. AI SRE is itself a bit of a problematic formulation but, like most labels it is a convenient shorthand description of the product's intent.
These platforms focus on automating the toil of site reliability, using machine learning to predict outages and suggest remediations before humans are alerted. They represent a shift from passive monitoring to active, autonomous system health management.
Bridging the disconnect between developers and observability is a vital task. These tools shift observability left, providing feedback loops directly within the IDE or CI/CD pipeline to help catch performance regressions during the coding phase. They empower engineers to understand how their code behaves in production without requiring them to become infrastructure experts.
There is a lot of bad telemetry out there. That is not an accusation - just a statement of fact and a consequence of the fact that there is a general observability knowledge deficit. OllyGarden are the first movers in this field and it is clear that there was a great untapped demand for the products and services they are offering.
As more organisations treat telemetry as a first-class citizen it is likely that more vendors will enter the sector.
These systems act as a routing and transformation layer, allowing organizations to filter, mask, and direct data to multiple backends based on cost or compliance needs.
This is a fast growing space spurred on by the explosive growth in telemetry volumes. Interestingly, even in a segment which was previously quite clearly delineated, the lines are suddenly becoming blurred - witness for example, Edge Delta's recent expansion into agentic observability.
As the name suggests, this category covers more specialist tooling geared towards monitoring of virtual or physical resources such as servers, networks, gateways and routers. Often these will be heavyweight systems capable of managing infra at vast scale and with deep insights.
They are essential for organizations maintaining physical or hybrid footprints where hardware health is as critical as application performance.
This is a category which we defined for products where the focus tends to be more on large enterprises with heterogeneous systems, especially infrastructure. Often these will be enterprises with hybrid infrastructure and a considerable number of infrastructure engineers. Even though the emphasis is on infrastructure, these systems may also offer APM capabilities.
These vendors excel at managing the complexity of legacy migrations and multi-cloud environments within a single administrative framework.
A relatively small, but nonetheless critical category. This is the outside-in obsevability that let's you know whether the rest of the world can actually see your systems.
IPM focuses on the factors beyond the firewall, such as BGP routing, DNS health, and CDN latency, that can impact user experience. It provides the "external truth" that internal monitoring systems often miss.
This is a category which could arguably include products such as Grafana and SquaredUp as they are both platforms with powerful dashboarding capabilities. However, one of our rules is that a product cannot appear in more than one category. Since Grafana and SquarewdUp have already been assigned to other categories, this leaves Perses as the sole players in this field.
There are a number of vendors that use the rubric of Operational Intelligence - notably AWS and Splunk, but SquaredUp are the only vendor that uses the term to define their own positioning.
This category focuses on high-level data synthesis to provide a strategic view of organizational health rather than just technical health. It aims to turn raw telemetry into business-ready insights that help leadership make informed decisions about resources and risks.
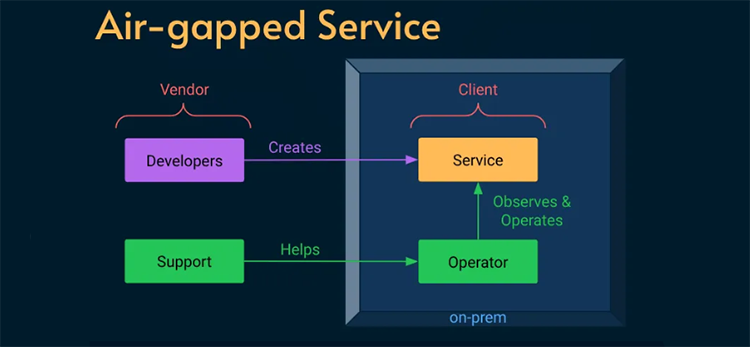
The excellent Alex Ewerlöf blog is now back in full swing and in this latest article he turns his attention to dealing with a real SRE curveball - how to build reliability engineering for an air-gapped system. We are talking hermetically sealed - not even a maintenance window for external connectivity. This task involved a high-security military facility where installing updates meant physically handing over an archive file to a system operator.
The constraints were pretty stringent - no logs, no metrics, no traces, no remote access of any kind.This was an extreme case and, ultimately, the solutions had to be both human-centred as well as relatively low-tech. How would you address the challenge? Hit the link below to read about the solution that Alex put in place.

In the past month or so the GitHub platform suffered a number of well-documented outages which resulted in loss of service for users. In the spirit of transparency, GitHub CTO Vlad Fedorov published this article on the GitHub blog, explaining the causes of the outages and the lessons learned as well as detailing the remediations that GitHub engineers will be putting in place.
The article really brings home the challenges of orchestrating the components of a global technology infrastructure - as well as the compounding effects of working at very large scale. The investigation revealed a perfect storm of edge cases, hidden tipping points and unforeseen knock-on effects. It’s impossible not to feel for the engineers sweating in the war-rooms as the dramas unfolded - after all, watching your failover fail must be pretty gut-wrenching.
If the Observability world had a code of secrecy akin to that of the Magic Circle, then Charity Majors might be in danger of being banished to exile and ignominy. In a single slide deck, she has blown the gaff on a whole trove of insider knowledge. It is the “What they don’t teach you at Harvard Business School” of observability knowledge. Not the abstract theory or technical detail but lessons and insights from the o11y frontline.
The deck in question was used in a talk at the LeadDev event in Berlin earlier this month and its 52 slides are an illuminating distillation of observability wisdom. We actually weren’t present at the talk and only came across the deck thanks to a mention in Michael Hausenblas’s excellent olly news newsletter. However, the slides contain sufficient clues (and images of unicorns) to easily re-construct the narrative and win friends and influence people as an observability savant.

If you are an SRE, when an outage happens you will know about it pretty quick. With security breaches the picture is rather less clear as, by their nature, they are designed to go undetected. Intrusion detection therefore is often based on a mixture of tools designed to spot unusual spikes, suspicious patterns or failed logon attempts.
This article by Fatih Koç argues that one of the major difficulties involved in identifying attacks is that of correlating signals across multiple sources such as Falco, Prometheus, Kubernetes Audit Logs etc. In this article, he outlines a strategy for extracting relevant data from each of these sources and pulling it together into a single observability dashboard.

The first line of cyber defence is normally at the perimeter - preventing attackers from entering your network in the first place. The next line of defence is intrusion detection. This can often take the form of anomaly detection using a variety of heuristics.
There are also some more creative possibilities, such as the canary solution adopted by Grafana. Just as the canary in the coalmine sings to alert underground workers to the presence of toxic gases, Grafana’s canary was designed to alert them to the possible presence of intruders in their domain.

Load testing can be simple in theory but in modern distributed architectures, it involves a lot more than throwing requests at an individual service. This article on the Airbnb engineering blog looks at how the company’s engineers use the Impulse load-testing framework to handle a number of more complex requirements such as dependency mockingand managing messaging and asyncronous calls.
Unfortunately, at the moment Impulse is just an internal Airbnb framework, so you won’t be able to get your hands on it at present. At the same time, the article provides a valuable blueprint for tackling advanced, real world load testing scenarios.
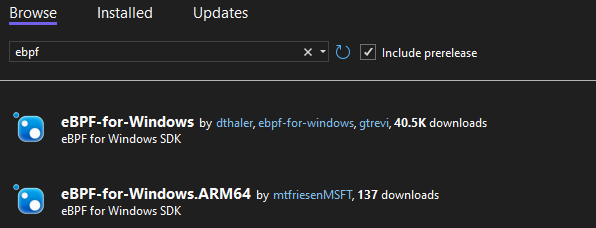
It's an announcement that might have seemed unthinkable not long ago, but the porting of the revolutionary eBPF technology to Windows is now a reality. The ability to bring safe programmability to the kernel has resulted in enormous gains in fields such as security, networking and observability for Linux hosts, so applying the same principle to the Windows ecosystem is obviously an attractive proposition. It is not, though, without its own difficulties. There were a lot of hurdles to overcome and, inevitably, given the differences in OS architecture, this is not a full-fidelity replica of the Linux implementation.
This possibly foundational article by Pavel Yosifovich guides you through the steps involved in boldly going where few have gone before and creating your first eBPF program for Windows. One paragraph in the article begins with the sentence “this is where things get a bit hairy“ - for some that will likely be a challenge rather than a deterrent. This may not be cooking up nuclear fusion in your bedroom, but it does feel pretty radical.
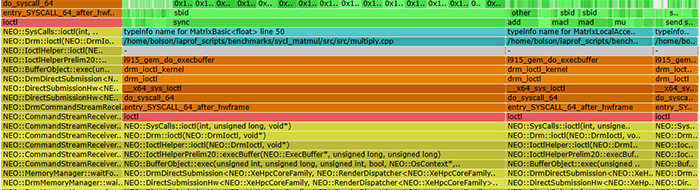
As well as rolling out their Open AI observability solution, Elastic have also been very active within the OpenTelemetry project. C++ has a reputation for being something of a fearsome foe for observability practitioners. In this article on the Elastic blog, Haidar Braimaanie dons his protective gear and attempts to tame the beast with a soothing dose of OpenTelemetry instrumentation.
Unlike languages built in frameworks such as .NET, C++ does not have a standardized runtime environment that supports dynamic instrumentation across all platforms and compilers. C++ also uses a variety of build systems such as Makefiles and CMake, so that implementing instrumentation can be difficult and error-prone. In the article, Haidar looks at adding OpenTelemetry support to a C++ application running on Ubuntu 22.04. He also includes sample code for instrumenting the project with database spans and then observing the application in APM.
After reading this article you may want to give the C++ developer in your life a hug.
Even if you are not familiar with the name of Brendan Gregg, you are almost certainly familiar with the fruits of his labours. Brendan is the creator of the Flame Graph - one of the most important and iconic visualisations in the observability toolkit.
We featured the Flame Graph in our recent tribute to the work of UX designers in the observability arena - but you should also visit Brendans’ web site.
Brendan's latest innovation is the AI Flame Chart. This is an evolution of the original flame graph and its ambitious aim is to help reduce the vast financial and environmental costs entailed in the use of LLM’s. This means that whereas the original flame graph was focused on CPU cycles, the latest generation sets its sights on reducing GPU load. The article discusses the considerable complexities involved in mapping GPU programs back to their corresponding CPU stacks.
The names of some of the instruction sets look intimidating to the uninitiated but the basic concept of the graph is quite simple - the wider the bar, the more resource it consumes.
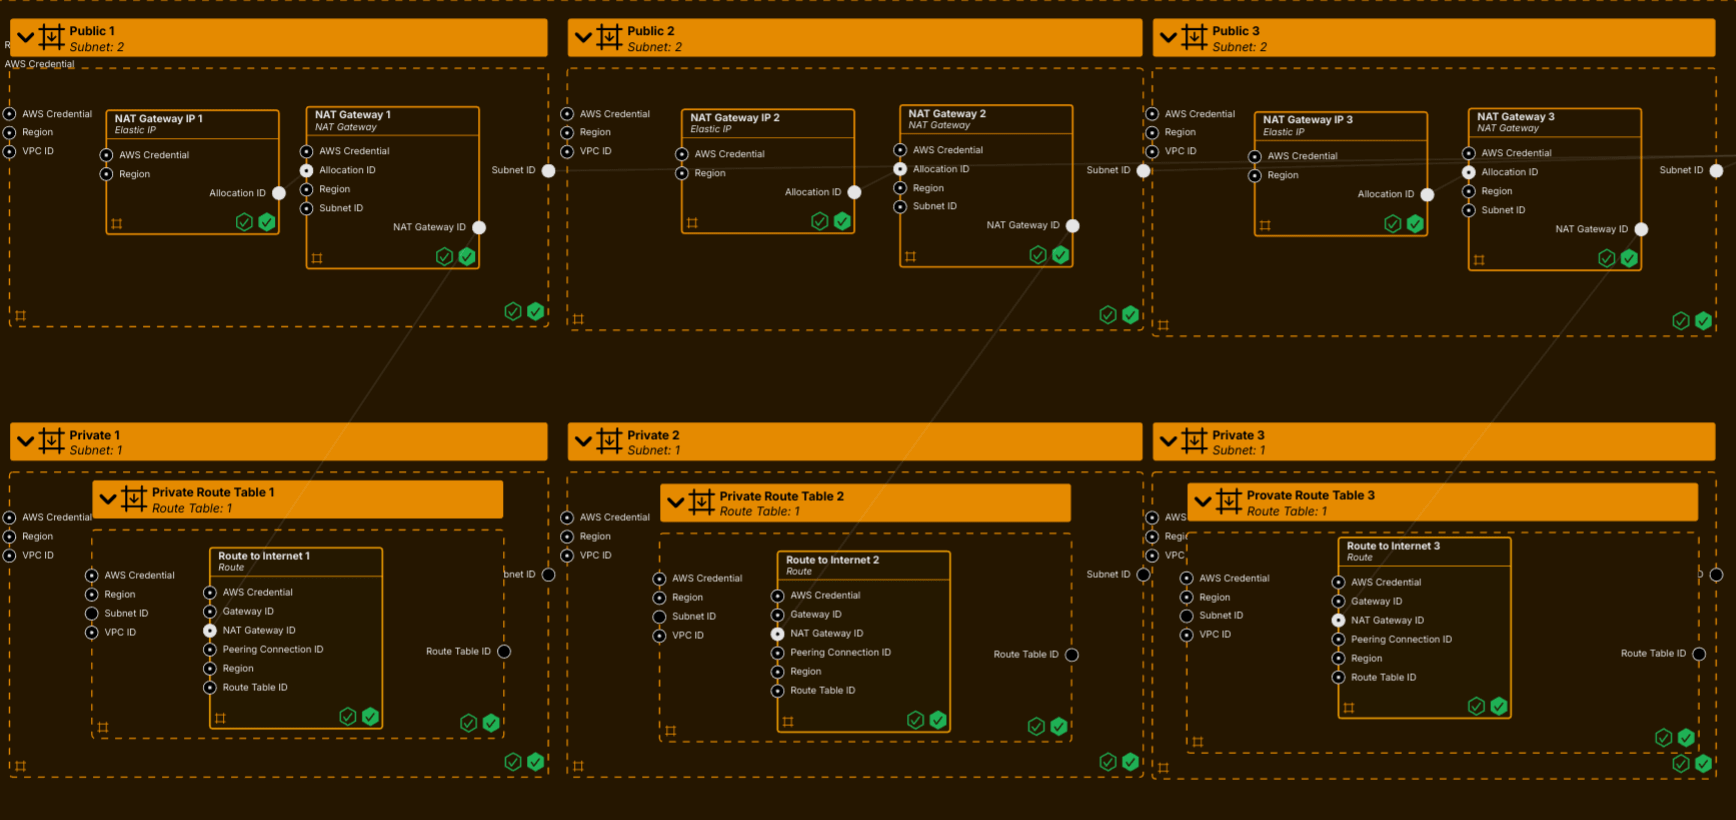
If you have ever had to grapple with a 3,000 line Helm chart to deploy your observability infrastructure, you may be forgiven for thinking that there must be a better way to do this. Whilst YAML has a certain formal elegance, its syntax struggles to express the architectures and relationships embedded in highly complex systems.
Whilst Pulumi have tackled this problem by enabling the use of high level programming languages for IaC, System Initiative are taking a fundamentally more radical approach. Their goal is nothing other than completely reinventing IaC from the ground up. The blog article for the launch of the product is an incredibly ambitious statement of intent. The terms ‘game changer’ and ‘paradigm shift’ tend to be thrown around somewhat casually, this might be a case where their usage is appropriate.
So, what are they proposing? Well, System Initiative is IaC without the code. It is a kind of digital canvas where you manipulate digital twins of your systems. Is the future here or is this the Platform Engineering equivalent of science fiction? Read the article and decide for yourself!