SigNoz - 16,000 Stars And Rising Pt2

Last updated: 2024-06-28

In the first part of this article we looked at getting SigNoz up and running and also looked at how it handles the three main signals of Alerts, Metrics and Traces . In this second part, we will look at features such as Alerts and Dashboards as well as taking a peek into the ClickHouse backend.

Alerts

SigNoz supports Alerts based on four different types of source:

  • metrics
  • logs
  • traces
  • exceptions

Like most alerting systems, the alert is defined on the basis of a query - and the query can be created using three different options:

  • the SigNoz Query Builder
  • a Clickhouse query (i.e. raw SQL)
  • PromQL

You assign recipients to an Alert by selecting an Alert Channel. These channels are defined in the SigNoz settings module:

Overall, creating alerts in SigNoz is a very smooth user experience.

Dashboards

As with most full-stack systems, SigNoz also supports dashboard creation. The UI will have a familiar feel if you are used to using a tool such as Grafana. As with Grafana, dashboards are built from panels and the panel creation screen consists of three main elements:

  • an output pane
  • a query builder
  • an attributes pane

Given that telemetry is stored in a Clickhouse backend, you could also, theoretically, build your dashboards in a separate Grafana instance and then connect to your data using a ClickHouse Data Source.

ClickHouse

One advantage of running SigNoz in self-hosted mode is that we have access to the ClickHouse backend database. This means that we can explore our telemetry using SQL queries.

The ClickHouse database will be running on a pod in our cluster, so the first thing we will need to do is connect to the ClickHouse client on the ClickHouse pod:

 kubectl -n signoz exec -i --tty pod/chi-signoz-clickhouse-cluster-0-0-0 -- bash 

Then in the bash session we run a very simple command to kick off the ClickHouse Client:

clickhouse client 

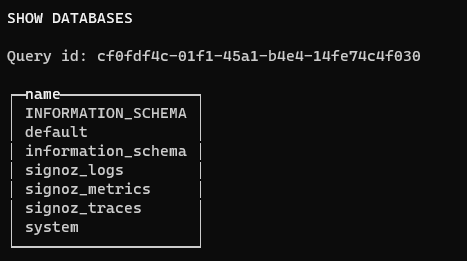
Now we can start exploring the backend databases that store our telemetry. This is a great advantage of running our own self-hosted instance.First of all we will list our databases:

SHOW DATABASES; 

The output from the SHOW DATABASES command will be something like this:

We are quite interested take a look around the signoz_logs database - so we will set that as our database context:

USE signoz_logs 

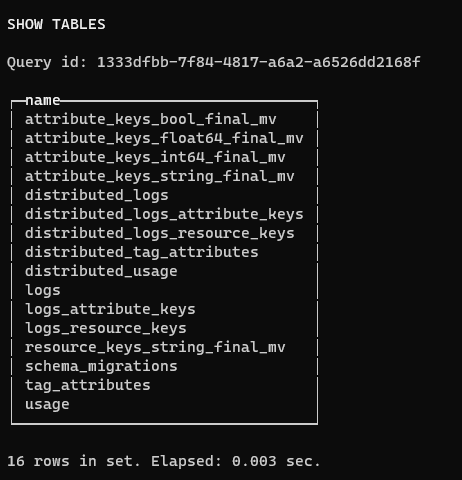
We can now delve into the tables in the signoz_logs database:

SHOW TABLES; 

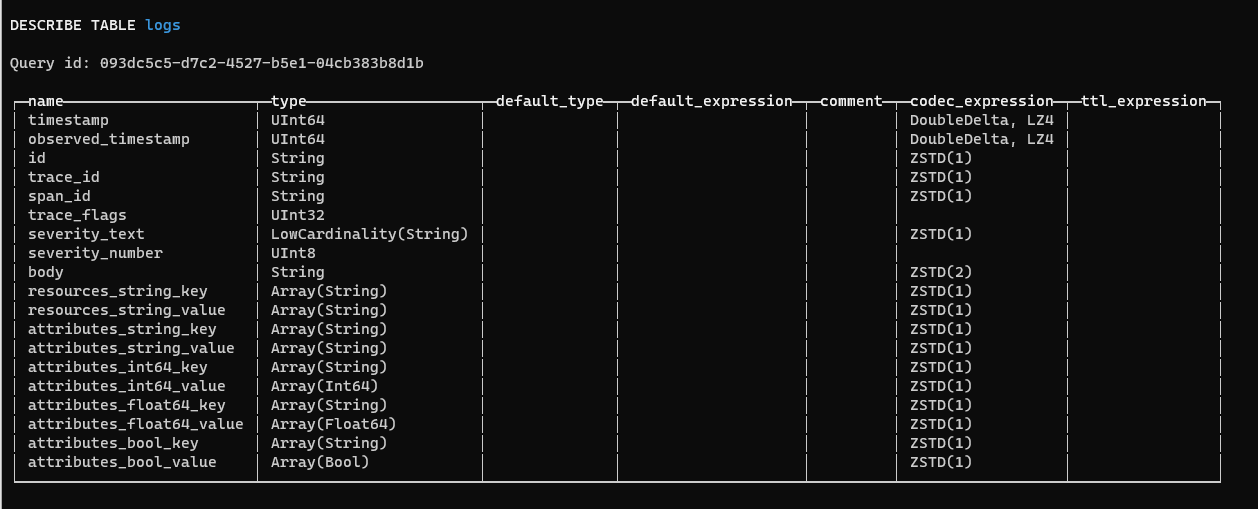
We are really keen to have a look at the structure of the logs table. To do this we just use the DESCRIBE command:

DESCRIBE TABLE logs; 

This is our output

This gives us some really fascinating insights into the internals of a ClickHouse database. As you can see, although we can query the database by using SQL commands, the actual data types are different to the standard ANSI SQL datatypes.

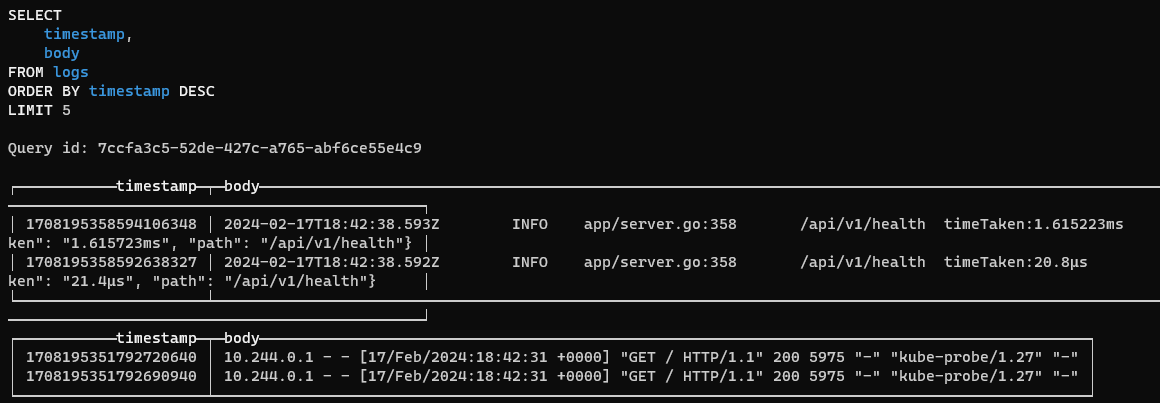
Now we are going to run a simple SELECT query to look at some log data:

SELECT 
    timestamp, 
    body 
FROM logs 
ORDER BY timestamp DESC 
LIMIT 5 

And the output looks like this:

This gives us fantastic power and flexibility in querying our logs. Next, let's have a look at the structure of our Trace data:

USE signoz_traces 

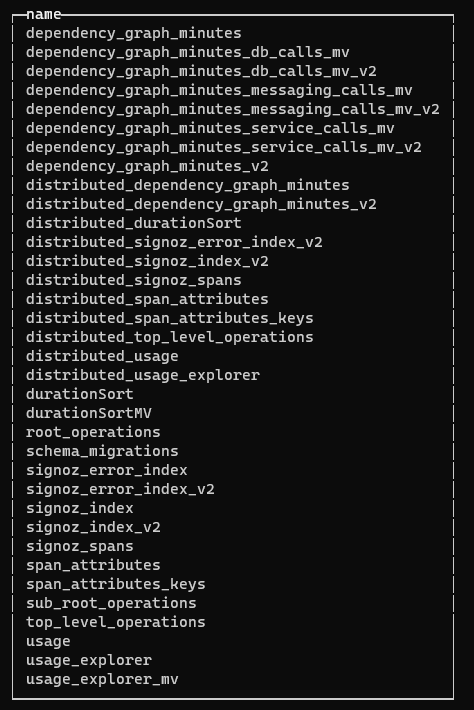
Once again, if we run the SHOW TABLES; command, we will get a listing.

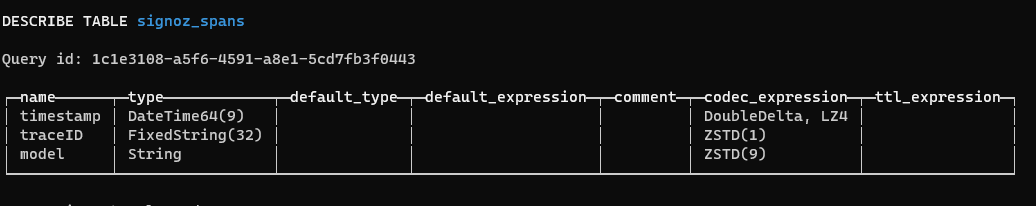
We are really interested to see how a span is represented, so lefts find out a bit more about the table:

 DESCRIBE TABLE signoz_spans; 

Interestingly, there are just three columns.

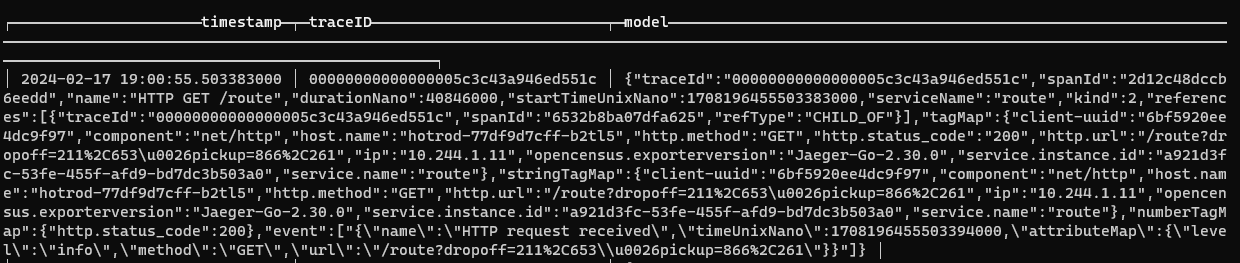
It will be interesting to see what the model column looks like. Let us see some raw data:

SELECT * FROM signoz_spans ORDER BY timestamp DESC LIMIT 5; 

As you can see, the model column contains a payload of interesting data:

For us, being able to dig around in your telemetry like this is not just fascinating, it is also simplifies querying, troubleshooting and maintenance.

Pricing

One of the major selling points of SigNoz is its price point. The pricing model is admirably clear and simple, and the cost is attractive. Pricing is based purely on data usage - there are no user-based or host-based costs.

There are two paid tiers - Teams and Enterprise. On The Teams Tier, there is a $199 per month base fee, which includes a data allowance based on the following pricing:

Once your usage exceeds a value of $199 then any further usage is charged at the above rates. Just doing some very simple maths we can say that this translates to roughly

  • 250 GB of logs
  • 250 GB of traces
  • 500 mn metrics samples

Conclusion

SigNoz is a scalable, capable and performant system. The system designers made three crucial decisions early on which have given them a solid foundation for their product:

  1. Making the product open source. This naturally helps SigNoz to connect with a large community of devs.
  2. OpenTelemetry compatibility. As well as allowing SigNoz engineers to leverage the benefits of resources such as the oTel SDK's, it also means that potential customers are not deterred by the prospect of vendor lock-in.
  3. Choosing ClickHouse as their backend. The original choice of backend for the system was Apache Druid. An interesting advantage of ClickHouse over a solution such as Druid is that it allows vendors to scale down the complexity of system installs - and this in turn reduces friction for developers who may be interested in evaluating the product.

Whilst SigNoz often compares itself to Datadog on price, we are not sure how helpful that comparison really is. Whilst SigNoz is a full-stack, application-centric product, Datadog is a full-spectrum observability and SIEM platform. Obviously, you may achieve lower costs for ingestion and retention of telemetry with SigNoz, but Datadog is unquestionably more feature-rich. If your main focus is around APM, then SigNoz it is a robust and mature open source solution.

Using the self-hosted option gives you a highly economical application monitoring platform. Whilst it is full-stack in the sense that it supports metrics, logs and traces, the overall feature set will probably appeal more to developers or users looking for an application monitoring solution. As the system is OpenTelemetry compliant, it will obviously ingest logs and metrics from resources such as VM's, but the process is largely manual.

From the point of view of adopting the self-hosted option, we found the general lack of support for Windows in the documentation and set up scripts slightly surprising. It was not difficult for us to get up and running using a Windows client and this lack of support may well be a turn-off for some potential users thinking about evaluating the product.

Open source projects come and go, so there is always a risk of the project losing momentum and no longer being maintained. There seems little prospect of this with sigNoz. The company is very proactive in developing and promoting the project and there is a continual stream of new features and refinements. For example, SigNoz engineers have recently added features such as Long Term Storage of Logs and integration with Langtrace. The GitHub repo boasts 16k stars and 9.6 million docker downloads.

Appendix - Cluster Restarts

We ran our install on a dev environment, where the clusters may be regularly re-started. Unfortunately, this caused something of a headache as the Clickhouse resources did not terminate properly and were still hanging in a terminating state when the cluster re-started.

This in turn meant that the SigNoz services could not restart correctly. We tried patching:

                                 kubectl patch pvc data-volumeclaim-template-chi-signoz-clickhouse-cluster-0-0-0 -p '{"metadata":{"finalizers":null}}' -n signoz
                            

But, alas, this didn't do the trick:'

We therefore resorted to a force delete the clickhouse pod:

kubectl delete pod chi-signoz-clickhouse-cluster-0-0-0 --grace-period=0 --force -n signoz

We had to run a few more re-starts - including one where a presumably unfinished task deleted the Clickhouse cluster - which again meant that the SigNoz services failed - but eventually we managed to get everything up and running again.

The Signoz documentation (https://signoz.io/docs/operate/kubernetes/) recommends the following steps:

                                kubectl -n signoz patch clickhouseinstallations.clickhouse.altinity.com/signoz-clickhouse -p '{"metadata":{"finalizers":[]}}' --type=merge
                            

And then the following command if associated PVC's need to be deleted:

                                kubectl -n signoz delete pvc -l app.kubernetes.io/instance=signoz
                            

And then deleting the namespace

Even when we tried this there were still resources left over. We had to delete the clickhouse CRD's

                            kubectl delete pod chi-signoz-clickhouse-cluster-0-0-0 --grace-period=0 --force -n signoz
                            

Even then that did not work and the only thing that completed cleanup was removing the finalizer from the YAML specification for the clickhouse installation

This is obviously a bit messy and deleting finalizers is a bit of a last resort. Obviously, this is not a fault inherent in SigNoz itself and it is unlikely that you will be re-starting your clusters in production environments.