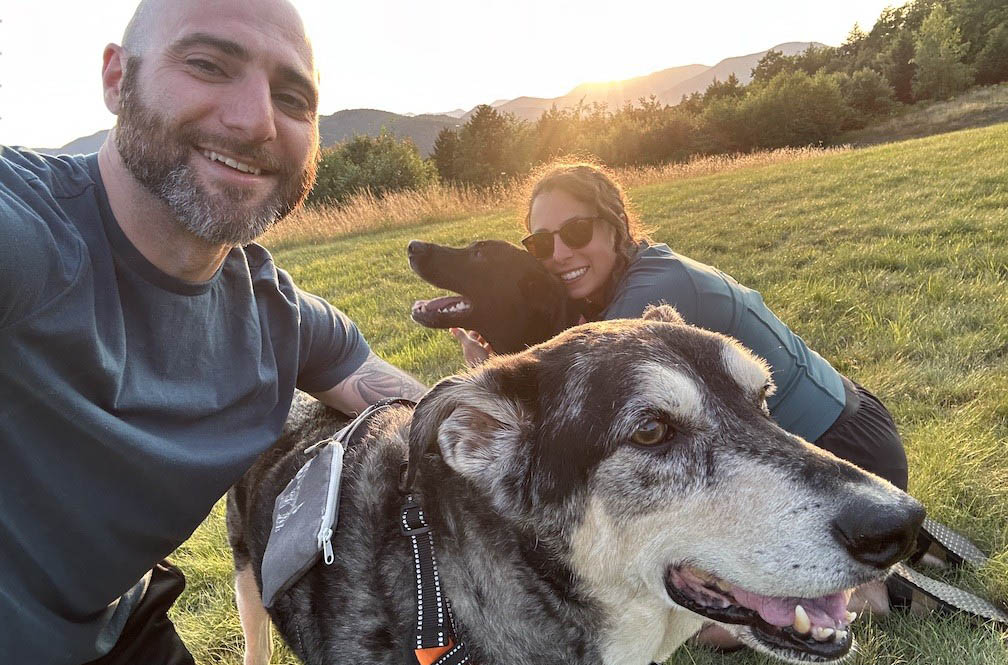
My title is Staff Site Reliability Engineer, and my role involves supporting and improving our observability tooling, enhancing incident response maturity, and working across the organization to help wherever needed, particularly in regards to keeping things running smoothly in production.
On any given day I might be investigating the root cause of an incident, troubleshooting build tooling, writing code, conducting a deep dive into some anomalous signal, or training engineers on how to interpret dashboards or metrics. I also help run a “metrics guild” which meets once a month where I prepare micro-learnings about using observability tools for monitoring and troubleshooting. I spend a lot of time thinking about ways to disseminate all the learnings from working with a diverse set of teams who encounter various challenges.
My role gives me a unique vantage point that spans infrastructure, platform services, application services, major changes or incidents, and all our tooling. This combination of contexts allows me to connect the dots and solve complex problems.
The first time I heard about the role of “Site Reliability Engineer” was a few jobs back when a VP approached me to bootstrap the company’s first SRE team. At the time, I was working as a Software Engineer and discovering the power of using New Relic to answer various ambiguous questions during production incidents. Suddenly, a team of three of us were tasked with being on call for the entire platform, requiring us to delve into unfamiliar territory. Learning how to leverage our telemetry signals - and eventually augment and extend them to make our system more observable - became a necessity for survival. Two years later, that VP would often brag about how our SRE team could get to the root cause of anything in “15 seconds” (just a slight exaggeration 😅). From there, I became addicted to the power that comes with knowing how to “read the tea leaves”.
In my current role, I primarily use Datadog for APM and metrics, and Splunk for logs. In previous roles, I used New Relic and ELK.
I have some exposure to Sentry for specific use cases, and I often experiment with open-source platforms like Elastic and SigNoz in small labs and personal projects.
I have this strange nostalgia for New Relic since it was the first tool I became intimately familiar with, and we went through so much together. I sometimes dream about writing NRQL queries… is that weird?
I believe it’s crucial to define a common interface for system components or services. For example, using common logging patterns, a core set of metrics, and consistent tracing conventions. Establishing these standards provides a solid baseline for observability.
In various positions, I've faced the frustration of navigating multiple similar tools used simultaneously and dealing with inconsistencies and duplication between them. For example, if both a Dropwizard metric registry and a Micrometer registry are used in the same Java application, the aggregation and reporting of timers or histograms can differ enough to confuse engineers who see different values for the same metrics.
The idea of unifying the approach to instrumentation through OpenTelemetry is very appealing to me. I have been closely monitoring this space and learning about it to identify when it might be an optimal solution for these types of problems.
We are only using OpenTelemetry for a few use cases currently, filling some small gaps in our other tools. However, I spend a significant amount of my personal time studying and contributing to various OpenTelemetry projects. I've always been fascinated by the tools I use daily, and I find that understanding how they work makes me a better operator.
Since OpenTelemetry is open source, it has allowed me to learn extensively about different implementations of instrumentation and new ways to approach observability. There are many smart and friendly people working on innovative projects in the community, and I enjoy following and learning from them.
I see OpenTelemetry as an exciting direction for the observability space, with significant momentum from many different vendors. The ability to decouple a bit from specific backends is a huge selling point. It feels like we're just at the beginning of its potential.
I spend a lot of time reading books, Reddit, and blogs, watching conference talks on YouTube, listening to occasional podcasts, and closely following several OpenTelemetry special interest groups. I watch or tune in to their weekly Zoom meetings and spend time hanging out in their slack channels. I learn best by doing, so I create small labs to experiment with new things or find ways to contribute to open source projects.
Every morning, I dedicate at least 25 minutes to a focused reading or study session, usually related to observability topics. For example, lately, I’ve been alternating between studying the OpenTelemetry documentation (and finding ways to contribute while I’m at it) and reading the new “Learning OpenTelemetry” book by Ted Young and Austin Parker.
Jay DeLuca is a Staff Site Reliability Engineer for Toast Inc, a provider of electronic services to the restaurant industry.
If you would like to feature in Observability People, please get in touch!