In the first part of this article we looked at eBPF from a general point of view and discussed some of its overall impacts on observability practice and implementations. In this second part, we will look at some of the specific technical and functional aspects of the use of eBPF in a number of leading products.
Many people might regard Cilium as a networking or network security tool but it is also, in both a literal and practical sense of the word, an observability tool. For any SRE, DevOps or Cloud Engineer who really wants an understanding of the state of connectivity and traffic flows and in their K8S cluster, it is a godsend. It is not an observability stack and it does not process telemetry. It is, however, a very useful part of any observability toolkit. Once installed on a K8S cluster you can achieve deep and granular insights by running some very simple commands on the Cilium CLI. You can easily view all of the endpoints in a K8S network and view details such as status, IP address, MAC address and node.
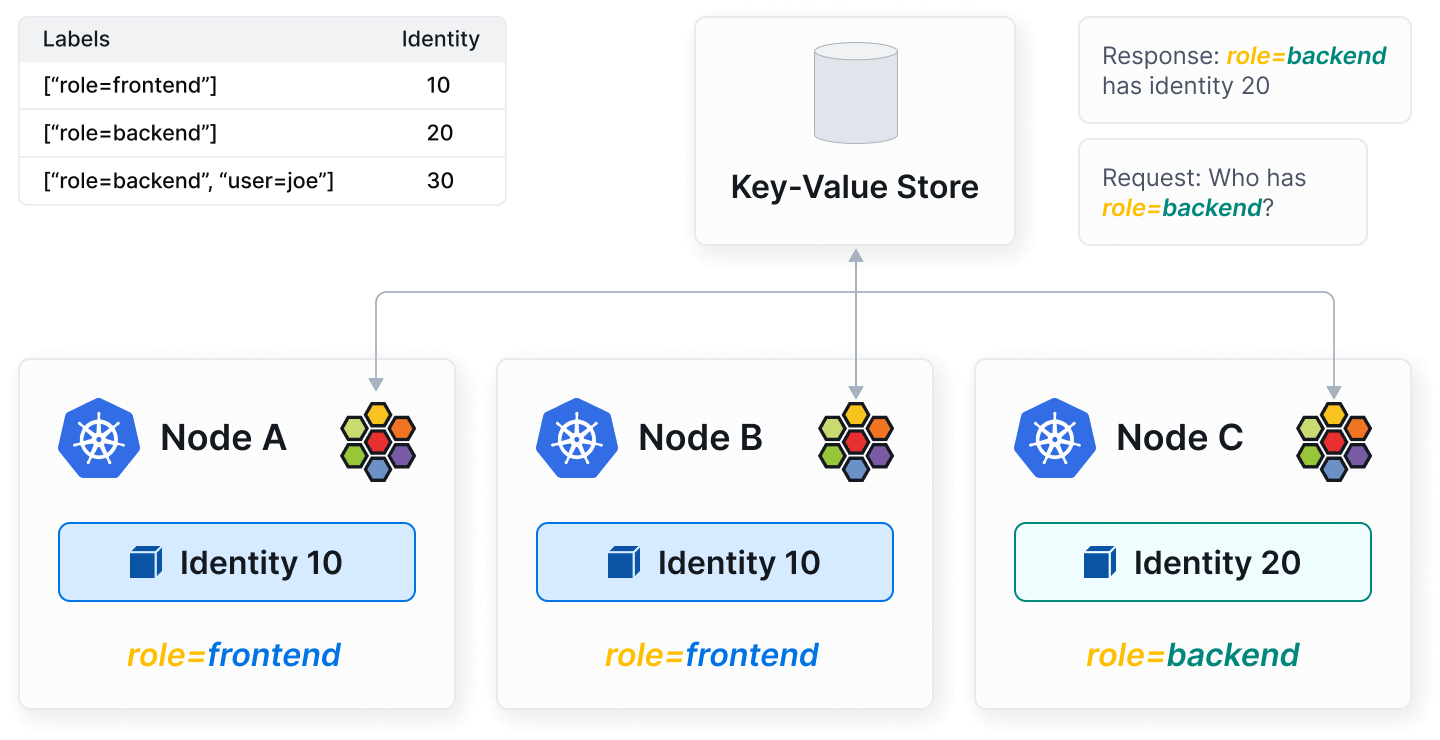
You can also easily run tests which will probe into different aspects of network connectivity, including intra-node, inter-node, and external requests. The connectivity tests will also validate DNS resolution and http/https requests - which can be a really vital aid to debugging K8S connectivity issues.
Cilium also ships with a module called Hubble - which, given its name, is perhaps not surprisingly described as the observability component of the solution. Hubble allows users to visualize and monitor network flows in real-time, providing detailed information about the source, destination, and type of traffic flowing through the cluster. It offers detailed observability into security-related events, such as policy decisions, allowing users to see which network policies are being enforced and how they affect traffic. This is essential for security auditing and compliance. If you would like to find out more about setting up and running Cilium and Hubble then have a read of our recent article.
Groundcover is a tool which we mentioned recently in our Beyond The Single Pane of Glass article. The GroundCover model is quite a radical departure from the standard approach to observability infrastructure. With Groundcover, the storage layer runs in the customer’s own environment. You can choose to manage the infrastructure yourself, or, if you do not want to take on this overhead, you can have it remotely managed by Groundcover engineers, who will take care of monitoring the system as well as managing patches and upgrades.
The diagram below gives us a useful starting point for understanding the implementation of eBPF in the Groundcover system.
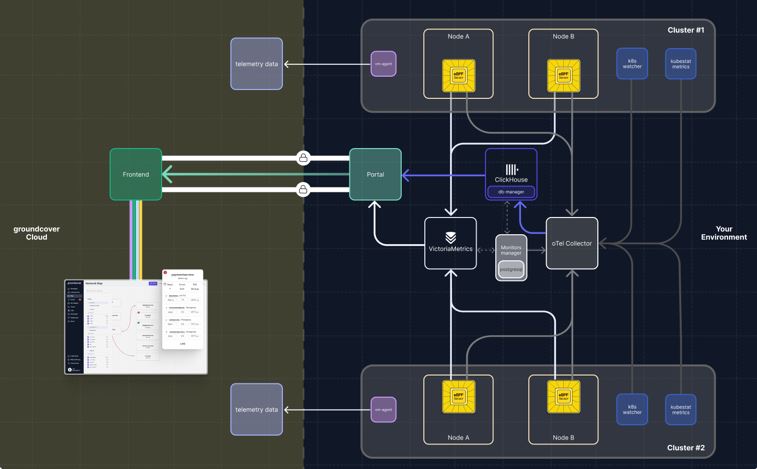
Groundcover uses a proprietary eBPF sensor to provide visibility not only for traces and metrics but also for logs. This goes one step further than many other solutions, which use eBPF for capturing metrics and traces and then use a tool such as the oTel collector for logs. Naturally, this assumes that the instrumented services are sending their logs to the standard output channels.
Even though many vendors in the marketplace are leveraging eBPF, expertise can vary widely. Some vendors build on top of existing SDK's whereas others go down the road of building up their own sensors. Groundcover are in the latter camp and recently developed Flora, an open source eBPF observability agent which is the engine for Groundcover's eBPF functionality and is built with a focus on performance and scalability.
The engineers behind Groundcover say that their sensor takes an 'opinionated' approach. Rather than just being a passive pipeline, it will make decisions on cardinality and create aggregations which streamline telemetry flows and reduce storage volumes (and hence costs). Processing, correlating and filtering telemetry as it is being streamed is a powerful capability and adds particular value when ingesting from sources such as the K8S metrics server, which can generate large volumes of largely redundant data.
This level of scalability is vital for Groundcover as it positions itself as an observability platform for solutions that run in environments with thousands of nodes. Groundcover CEO Shahar Azaulay is a passionate advocate for the value of eBPF monitoring solutions, seeing them as central to a 'revolution' that will provide cost-effective solutions for log management, metrics and full tracing.
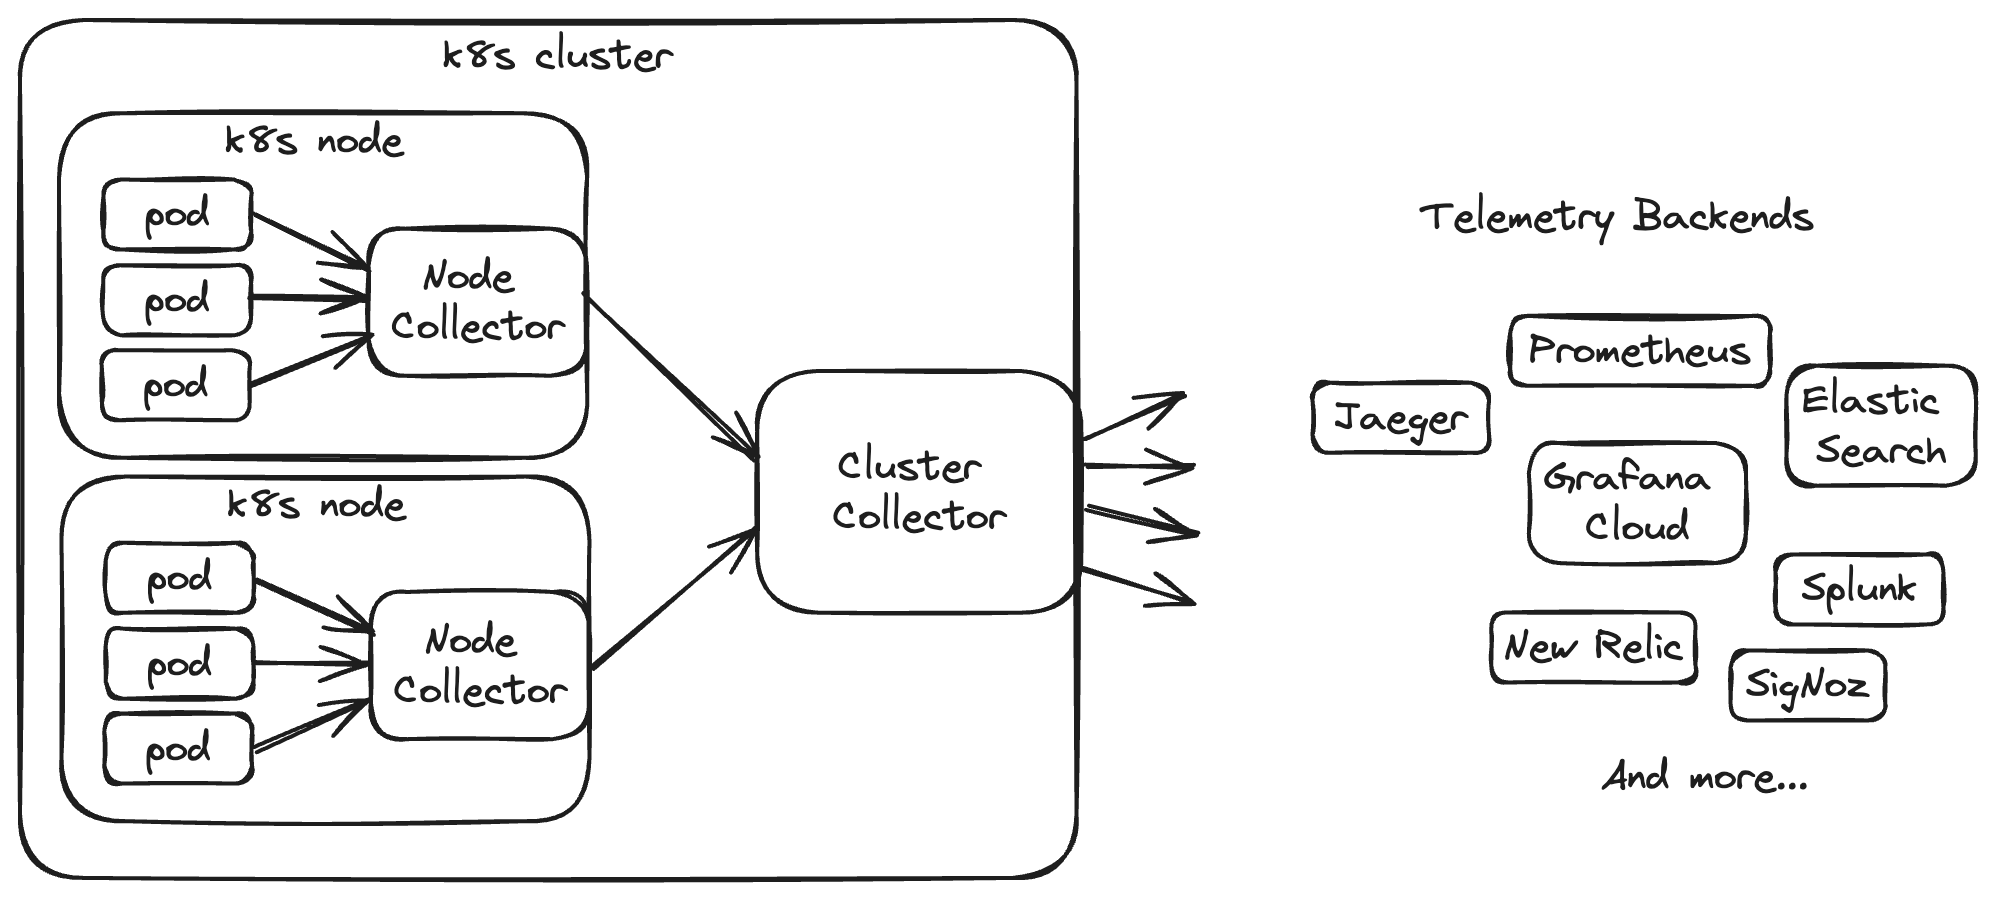
Odigos is an open-source project that uses eBPF to generate distributed traces in OpenTelemetry format, with support for over 30 observability backends. They are heavily committed to OpenTelemetry and the oTel project's (eBPF-based) auto-instrumentation for Go applications was developed by engineers at Odigos.
Like many eBPF solution providers, Odigos emphasise speed and simplicity of onboarding compared to SDK-based products. They claim that you can be up and running on their platform in a matter of minutes. On-boarding is a simple, two-step process which consists of selecting an application and then a backend (Odigos does not have its own storage - instead you send telemetry to the backend of your choice).
Odigos supports a number of languages including Java, Python, .NET, Node.js, and, of course, Go. Like other tools, it supports metrics and logs, but the developers behind the product really emphasise its handling of distributed traces as a stand-out feature. Propagating context across services can be fiendishly tricky and Odigos claim to be the only solution on the market capable of "100% tracing parity". This is achieved through various eBPF mechanisms that securely and reliably inject the relevant headers. One such mechanism involves tracking functions and structs across different versions of open-source libraries.
One other interesting feature of Odigos is its technique for language detection. This is obviously a challenge for eBPF applications as they are running in the kernel, rather than being attached to the executable itself. Additionally, the act of detection can itself create latency. Initially, the Odigos Instrumentor would spin up an ephemeral language detection pod. This would inspect code running in an application pod, report the language back to the Instrumentor and then be terminated. As well as creating a performance overhead, this also required elevated privileges and could even result in OutOfPods errors. Languages are now resolved via a virtual device running on each cluster node. This improves performance and scalability by removing the overhead of creating and deleting pods. For Odigos, this is an important consideration when running in environments with thousands of microservices.
Beyla is an open-source eBPF monitoring tool unveiled by Grafana at last year's ObservabilityCON event in London. In common with the products we have already covered, it enables automatic instrumentation for applications written in a number of applications including Go, C/C++, Rust, Python, Ruby, Java, NodeJS, .NET, and more. At present in will capture metrics and traces, but not logs.
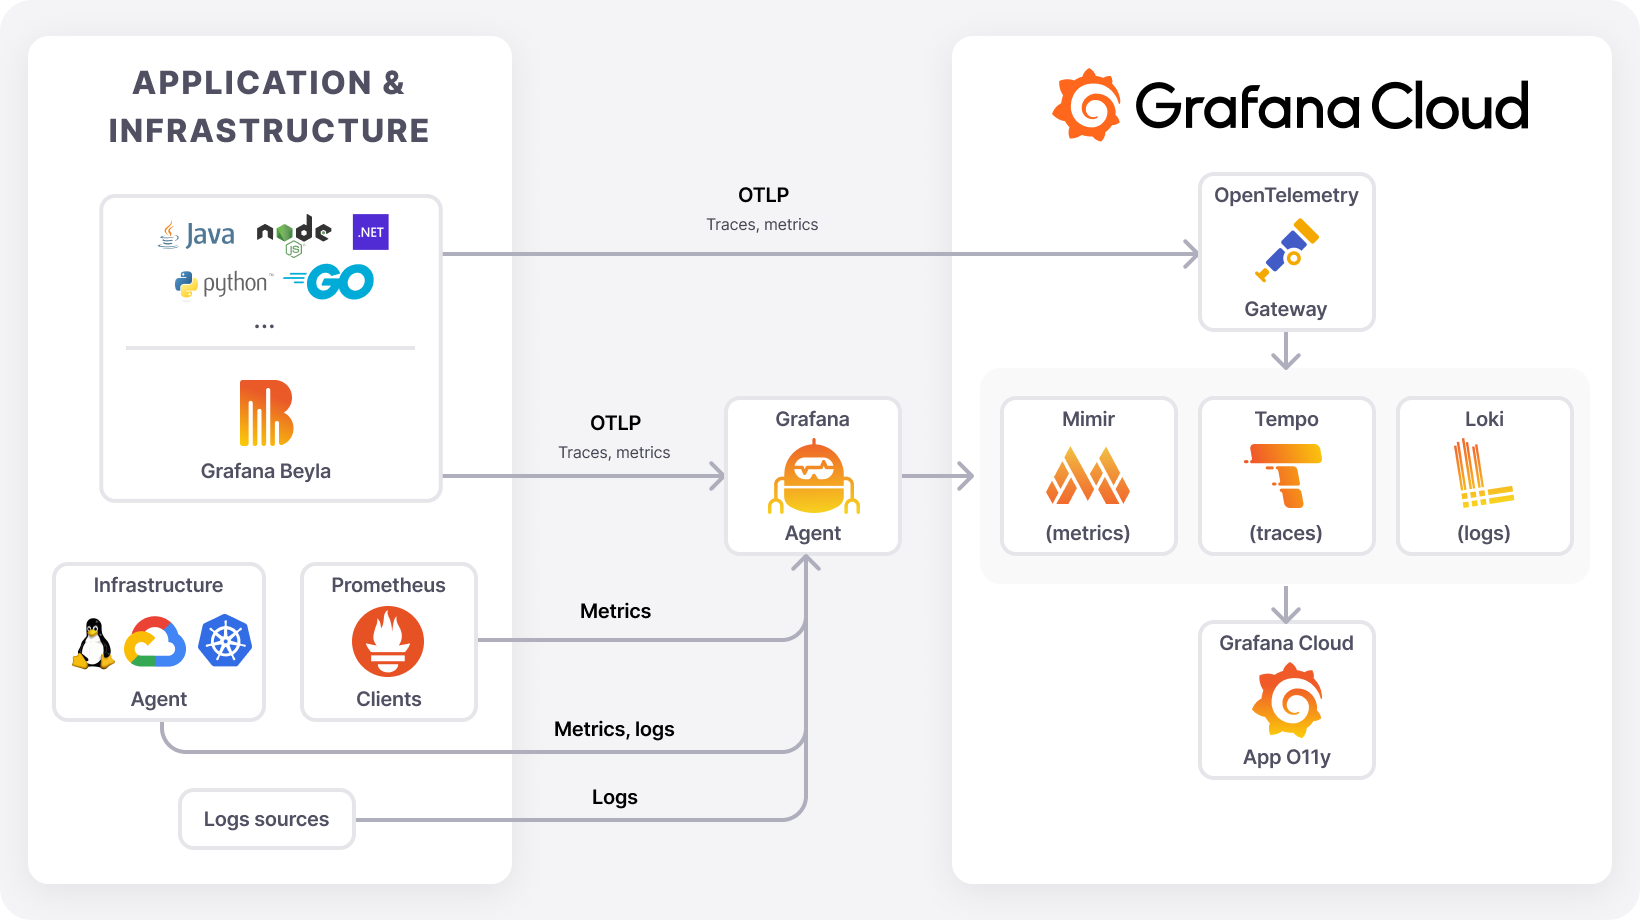
In our discussions with vendors, a recurrent theme is the complexities involved in capturing traces using eBPF - particularly in terms of propagating Trace Ids to upstream services. Grafana Labs takes a two-pronged approach to addressing this problem. This involves a combination of automatic header injection and black-box context propagation. Automatic header injection involves using eBPF probes to read the incoming trace information and then injecting the trace header in outgoing calls. Whilst this capture and inject method is conceptually simple and self-contained, a current limitation is that it only works with the Go programming language. Black-box context propagation on the other hand, requires a more stateful and orchestrated solution, but it will work with any programming language.
This method works by uniquely identifying each connection request when one service invokes another. When the request completes, it can then propagate the context to the receiving service by retrieving it from a locally stored eBPF map. Unfortunately, one limitation to this approach is that both services must reside on the same node. A solution to this would be to use external storage and this may be a feature in future versions of Beyla.
Beyla can be run as a stand-alone tool but it can also be run as a component within Alloy - the Grafana distribution of the OpenTelemetry Collector. Being able to bolt an eBPF sensor onto your oTel collector courtesy of some simple YAML config is a compelling proposition and an example of the kinds of power-ups that we can expect from custom distributions of the Collector.
Apache SkyWalking is a powerful open source observability platform with a large and robust ecosystem. It boasts a plethora of agents, which are responsible for gathering telemetry from clients and forwarding it on to a backend which is responsible for processing and storage. Rover is the Skywalking eBPF and agent. It provides code profiling but only for C, C++, Golang, and Rust. It also provides profiling for L4 and L7 network traffic and TLS. Although Rover has an extensive set of configuration options it does not, at present, support tracing.
The real strength of Rover lies in its network monitoring and profiling capabilities. The sensor has been constructed to provide deep and granular insight into network traffic and has an awareness of multiple networking protocols and technologies. It also ships with an almost dizzying array of configuration options. It generates a rich set of metrics to assist engineers with tasks such as troubleshooting network issues and monitoring service mesh performance.
In this article we have only actually reviewed a sample of the current implementations of eBPF in observability tooling. There are numerous other examples such as the Elastic Profiler (which has now been donated to the OpenTelemetry project) or the use of eBPF in platforms such as Datadog. Our main aim has been to cover the strengths of eBPF, the scope of its usage within observability solutions and some of its challenges and limitations at present. Our main takeaways are: